
Markets This Week: 5 Key Things to Watch (Oct. 5-9, 2026)

As geopolitical and inflationary tensions continue to linger, there are plenty of news developments ahead in the markets this week that should provide more insight into the health of the US economy and stock market. 1. US Services PMI One important piece of data to keep an eye on is the US Services PMI for September, which will be released on Monday, October 5th at 9:45 a.m ET. Data in recent months has exceeded expectations, as strong consumer demand has helped offset weaker growth in other areas.1 US Services PMI Data Recent growth in the services sector has also helped to offset comparatively slower growth in the US manufacturing sectors.2 Keep an eye on this new monthly data to see if this trend continues or if there is a reversal in this momentum. » Start investing today: Explore top brokerage accounts with our detailed review 2. US Trade Balance Another important piece of data to watch in the markets this week is the release of US trade balance data on Tuesday, October 6th at 9:45 a.m ET. Recent data from the beginning of Q3 was very concerning, as the US trade deficit reached a high not experienced since March 2025.3 The US export market has been showing concerning signs, as the US economy’s exports recently slumped by 2.1% in July, according to data released in early September.4 This data should provide a better picture of the health of the US economy amid the trade war and geopolitical tensions. 3. Consumer and Labor Market Trends The combination of prolonged interest rates and sticky inflation has made things much harder for consumers in recent quarters. There are several important pieces of data to keep an eye on this week, which will complement recent inflation data: Consumer credit data will be released on Wednesday, October 7th at 3 p.m ET. Weekly jobless claims will be released Thursday, October 8th at 8:30 a.m ET. University of Michigan preliminary consumer survey will be released on Friday October 8th at 10:00 a.m ET. ETFs like the State Street Consumer Staples Select Sector SPDR ETF (XLP), which performed very well this year, could be worth monitoring.5 State Street Consumer Staples Select Sector SPDR ETF Performance Consumer staples stocks are generally perceived as a safer bet amid economic tensions and have so far performed very well in the market. Be on the lookout for any changes in consumer sentiment. » Ready to invest for retirement? Check out our review on the top IRA accounts 4. Tech Stocks and Inflationary Concerns Tech stocks have still rallied by nearly 8% in the past month, despite the recent rate hike and inflationary concerns in the market. In particular, it is a good idea to keep a close eye on semiconductor stocks, which have been performing well amid strong earnings growth and acquisition activity.6 The weaker than expected Jobs report also helped to support sentiment for tech stocks. Many investors took this as a sign that the Fed may have more of a reason to delay rate hikes in upcoming meetings.7 Another important trend to monitor that will impact tech equities is the energy markets. Any long-term inflationary fears could spark the risk of additional rate hikes, a move that could deter tech equity investors. 5. Earnings to Watch This Week There will also be a large number of significant earnings released for consumer companies in the US stock market. Company Earnings Release Constellation Brands Tuesday, October 6th after the market closes Levi Strauss Wednesday, October 7th after the market closes Pepsico Thursday, October 8th after the market closes Delta Airlines Friday October 9th after the market closes These results represent a balance of key themes in the US economy, and should provide more data regarding the health of US consumers. » Stay ahead of your finances: Join our free newsletters today
Best IRA Accounts for October 2026: Find Your Ideal Match

A decade ago, opening an IRA meant visiting a bank, filling out paperwork, and paying fees to trade. Today, you can open an account from your phone in minutes, trade for free, and access tools once reserved for Wall Street insiders. Some brokers even offer contribution matches similar to a 401(k). But more choices have created a new problem: decision paralysis. With dozens of providers claiming to be the “best,” how do you choose? At InvestLane, we use a 10-factor rating system to cut through the marketing noise and focus on what truly matters for your long-term success. » Why trust InvestLane? See how we rate our top IRA accounts. Best Individual Retirement Accounts (IRAs) for October 2026 Which IRA Account Is Right for You? Fidelity Investments: Best Overall Online Broker InvestLane Rating: 5.0 /5 OPEN AN ACCOUNT on Fidelity’s website QUICK FACTS Fees: $0 per equity trade ($0.65 per options contract) Account Minimum: $0 Promotion: None no promotion available at this time Our Review Pros: Wide variety of investment products and account types, including fractional shares and automated features. Commission-free stock, ETF, and options trades ($0.65 per options contract). Earn competitive interest rates on uninvested cash. Strong customer service available through phone and 24/7 via chat. Professional and robo-advisory options available. Highly rated mobile and desktop platforms. Cons: No futures trading available. No paper trading or simulation tools. Broker-assisted trades can be costly. Our Take: Fidelity is a trusted, cost-effective brokerage that simplifies investing for both beginners and seasoned investors. With powerful research tools and a great customer support, you’ll always have the guidance you need. It’s an excellent choice if you want a reliable partner to help grow your wealth for the long term. SoFi Invest IRA: Best For User-Friendly Investing InvestLane Rating: 4.6 /5 OPEN AN ACCOUNT on SoFi’s website QUICK FACTS Fees: $0 per trade Account Minimum: $0 Promotion: 1% IRA match on rollovers and contributions Our Review Pros: Commission-free stock, ETF, and options trades (no options contract fees). Fractional share investing with as little as $5. Multiple account types, including IRAs, margin, and robo-advisor (SoFi Automated Investing). Highly rated, beginner-friendly mobile and desktop platforms. Simple-to-use automation features. Consistently offers competitive promotions for new users SoFi Plus members get 1% match on recurring invest deposits and unlimited financial planning calls. Cons: Limited portfolio analysis tools Does not offer paper trading. Low interest earned on uninvested cash. Our Take: SoFi is a solid choice for beginners due to its commission-free platform, unique investment options, fractional shares, and automated investing. Though it lacks advanced tools, it stays intuitive and low cost. Interactive Brokers: Best for advanced investing InvestLane Rating: 4.5 /5 OPEN AN ACCOUNT on Interactive Broker’s website QUICK FACTS Fees: $0 per trade ($0.65 per options contract, 0.12-0.18% crypto) Account Minimum: $0 Promotion: None no promotion available at this time Our Review Pros: Access to 160+ global markets and 18,000+ mutual funds. Low-cost stock, ETF, and options trading with tiered pricing. Powerful trading platforms such as Trader Workstation and GlobalTrader app. Competitive margin rates among the lowest in the industry. Wide-ranging research and educational resources. Fractional shares and automatic dividend reinvestment. Cons: Complex platform may overwhelm beginners. High minimum to earn interest on uninvested cash. Our Take: Interactive Brokers offers global markets, low fees, and advanced trading tools, making it ideal for experienced investors. While beginners may find it complex, its margin rates and flexible accounts suit serious, cost-conscious traders. Robinhood IRA: Best For Simple Investing InvestLane Rating: 4.6 /5 OPEN AN ACCOUNT on Robinhood’s website QUICK FACTS Fees: $0 per trade Account Minimum: $0 Promotion: 1 free stock after linking your bank account (stock value range $5.00-$200) Our Review Pros: Commission-free stock, ETF, crypto, and options trading. Clean, beginner-friendly platform and mobile-first design. IRA with up to 3% match for Gold members. Fractional shares and recurring investments. 24-hour trading and new Legend web platform for active traders. Cons: No mutual funds or fixed-income investments. Without Gold membership, features are much more limited. Less transparency in key areas. Platform lacks depth for advanced traders. Our Take: Robinhood is ideal for beginners and casual investors seeking a simple, stress-free way to trade stocks, ETFs, options, and crypto, with fractional shares. While it lacks advanced tools and asset variety, its clean interface and accessibility make it a straightforward choice for those prioritizing ease and clarity. Charles Schwab IRA: Best For Traditional Investing InvestLane Rating: 5.0 /5 OPEN AN ACCOUNT on Charles Schwab’s website QUICK FACTS Fees: $0 per equity trade ($0.65 per options contract) Account Minimum: $0 Promotion: None no promotion available at this time Our Review Pros: Commission-free stock, ETF, and options trades ($0.65 per options contract). Wide range of investment products and high-quality research insights. 24/7 phone support and access to in-person branch services. Multiple trading platforms including Schwab.com and thinkorswim. Extensive educational resources, podcasts, videos, and trading demos. Paper trading available through thinkorswim’s paperMoney. Integrated SBLOC services for flexible borrowing against portfolio. Cons: Supports fractional shares, but has limitations compared to other brokerages. Higher fees for futures trading and over-the-counter equities. Uninvested cash does not earn interest. Our Take: Charles Schwab is a top brokerage offering a wide range of investments, robust platforms like thinkorswim, and rich educational resources, making it beginner-friendly. With 24/7 support and in-person branches, it provides reliable guidance, and despite some higher fees, it remains an excellent all-around choice for investors. Public IRA: Best For General Investing InvestLane Rating: 4.5 /5 OPEN AN ACCOUNT on Public’s website QUICK FACTS Fees: $0 per trade Account Minimum: $0 Promotion: Earn up to $10,000 when you transfer your investment portfolio to Public Our Review Pros: Commission-free stock, ETF, crypto, and options trades. Fractional share investing with no minimum balance required. Competitive interest rates earned on uninvested cash. Clear, straightforward, and user-friendly platform. Unique social community where investors share ideas, insights, and opportunities. Cons: Limited research and analysis tools when compared to top brokerages.
Best High-Yield Savings Accounts for October 2026: Up to 4.20%

High-yield savings accounts (HYSAs) offer much higher annual percentage yields (APYs) than traditional savings accounts, allowing your savings to grow 10–15× faster. SoFi currently offers the highest-earning account with potential for up to a 4.20% APY for new users. The best high-yield savings accounts consistently deliver strong rates, helping your savings grow faster and more securely, all backed by FDIC insurance. Check out the best high-yield savings accounts for October 2026 and start growing your savings today. Best High-Yield Savings Accounts for October 2026: Up to 4.20% APY Which High-Yield Savings Account Is Right for You? SoFi Checking and Savings: Best Overall High-Yield Savings Account InvestLane Rating: 4.9 /5 OPEN AN ACCOUNT on SoFi’s website QUICK FACTS APY: Up to 4.20% With eligible direct deposit. No minimum balance required. Promotion: Up to $400 bonus + 0.90% APY boost Six-month APY boost for new customers with eligible direct deposit. Offer ends by 12/31/2026. Terms apply. Our Review Pros: Among the most competitive sign-up bonuses in the industry. Competitive APY with no minimum balance required. No fees on monthly maintenance or withdrawals. Easy-to-use mobile app for seamless account management. Extra FDIC insurance provided through SoFi’s partner banks. Automatic savings tools and round-up features to help grow your balance. Cons: APY boost requires meeting deposit or direct deposit conditions. No physical branches, fully digital banking experience only. Our Take: SoFi is a strong option for savers who want a straightforward, no-fee account with a strong interest rate and rare bonus opportunity. Its user-friendly app and helpful saving tools make it perfect for those looking to grow their savings without the hassle. While it lacks in-branch access, it’s remains one of our top picks for simple, convenient saving. Openbank High Yield Savings InvestLane Rating: 4.8 /5 OPEN AN ACCOUNT our partner QUICK FACTS APY: Up to 4.20% $0 min. balance required for APY. Promotion: 0.35% APY boost Six month APY boost for new customer when you open and fund a new account by 11/03/2026. Our Review Pros: Competitive variable APY designed to help savings grow faster than the national average. No monthly maintenance fees or hidden charges. $500 minimum deposit required to open the account. FDIC insured, providing federal deposit protection up to applicable limits. Easy online account opening that can be completed in about 5 minutes. 24/7 account access through the Openbank mobile app. Security features such as trusted device verification and biometric authentication. Customer support is available through the app, including click-to-call assistance. Cons: No physical branch locations for in-person banking. A $500 minimum deposit is required to open the High Yield Savings account. The interest rate is variable and can change over time. Promotional APY boosts are limited to qualifying new customers and expire after the promotional period. Primarily designed for online savings rather than full-service, branch-based banking. Our Take: Openbank High Yield Savings is a strong option for savers who want an online savings account with a competitive variable rate, no monthly fees, FDIC insurance, and convenient digital account access. The account also offers a promotional rate boost for eligible new customers, although the boost is temporary and the standard variable rate applies afterward. The $500 minimum opening deposit and lack of physical branches may be drawbacks for some customers. Overall, Openbank is geared toward people who are comfortable managing their savings digitally and want a straightforward account focused on helping their money grow. CIT Bank Platinum Savings InvestLane Rating: 4.8 /5 OPEN AN ACCOUNT on CIT Bank’s website QUICK FACTS APY: Up to 4.10% $5,000 min. balance required for APY. Promotion: 0.35% APY Boost Enter promo code “CITBOOST” to receive a 0.35% APY bonus for six months from account opening. Terms apply. Our Review Pros: Earn competitive yields when you maintain a $5,000 minimum balance. FDIC insured up to the legal limit through CIT Bank, a division of First Citizens Bank. No monthly maintenance fees, making it cost-effective for savers. Fast online account opening with a streamlined digital experience. Reliable reputation with strong customer satisfaction and support. Cons: $5,000 minimum balance required to earn the top APY (lower balances earn significantly less). No physical branches, which may be a downside for those who prefer in-person service. Limited account types, no checking account bundled or direct ATM access. Our Take: CIT Bank’s Platinum Savings is a competitive option for savers who can meet the $5,000 minimum balance requirement. With one of the highest APYs available and no monthly fees, it’s ideal for those looking to maximize interest on larger savings balances. While it lacks branch access and a bundled checking option, its digital-first platform and strong yield make it a standout choice for disciplined savers staying in the right lane toward growing their money. Barclays Tiered Savings Account InvestLane Rating: 4.8 /5 OPEN AN ACCOUNT on Barclays’ website QUICK FACTS APY: Up to 3.65% $0 min. balance required for APY. Promotion: Get a $200 bonus After depositing $25,000. Offer expires 7/31/2026. Terms apply. Our Review Pros: Competitive high-yield APY with no minimum balance requirement No monthly maintenance fees or hidden charges. Easy online account management with a clean, user-friendly interface. FDIC insured up to $250,000, ensuring your funds are safe. No minimum deposit required to open an account. Cons: No physical branches for in-person banking. Limited to savings accounts, no checking or other account types available. No bonuses or promotional offers currently available. No ATM card or check-writing privileges. Our Take: Barclays Tiered Savings Account is a great choice for savers seeking a straightforward, no-fee account with a competitive interest rate and easy online access. While it lacks the perks of physical branches and additional banking products, its simplicity, strong APY, and reliable FDIC insurance make it ideal for those focused solely on growing their savings securely. Bread Savings High-Yield Savings Account InvestLane Rating: 4.7 /5 OPEN AN ACCOUNT on Bread Savings’ website QUICK FACTS APY: 3.95% only $100 to start (no minimum balance required after opening). Promotion: None No promotion available at this time. Our Review Pros: Competitive yields with
Best Brokerage Accounts for October 2026: Top Investing Platforms

Today, investing is easier than ever. Commission-free trades, no account minimums, fractional shares, and sleek mobile apps mean you can start with just $1. Most brokerages also offer retirement accounts, research tools, and educational resources that used to be reserved for professionals. But more choices can make decisions harder. Some platforms hide fees in the fine print, while others overwhelm beginners with too many tools. At InvestLane, we’ve carefully reviewed the top brokerage accounts for October 2026, focusing on what matters most: low costs, strong features, security, and an experience that actually makes sense. » Why trust InvestLane? See how we rate our top brokerage accounts. Best Brokerage Accounts for Stock Market Investing (October 2026) Which Brokerage Account Is Right for You? SoFi Active Investing: Best for User-Friendly Investing InvestLane Rating: 4.7 /5 OPEN AN ACCOUNT on SoFi’s website QUICK FACTS Fees: $0 per trade Account Minimum: $0 Promotion: Get up to $3,000 in Stock when you open and fund a new account with at least $50. Offer ends 10/18/26. Our Review Pros: Commission-free stock, ETF, and options trades (no options contract fees). Fractional share investing with as little as $5. Multiple account types, including IRAs, margin, and robo-advisor (SoFi Automated Investing). Highly rated, beginner-friendly mobile and desktop platforms. Simple-to-use automation features. Consistently offers competitive promotions for new users SoFi Plus members get 1% match on recurring invest deposits and unlimited financial planning calls. Cons: Limited portfolio analysis tools Does not offer paper trading. Low interest earned on uninvested cash. Our Take: SoFi is a solid choice for beginners due to its commission-free platform, unique investment options, fractional shares, and automated investing. Though it lacks advanced tools, it stays intuitive and low cost. Webull: Best for Active Trading InvestLane Rating: 4.6 /5 OPEN AN ACCOUNT on Webull’s website QUICK FACTS Fees: $0 per trade Account Minimum: $0 Promotion: Receive 12 free shares (valued $3-$300 each) and 1 month of Webull Premium when you open and fund a new account with at least $100. Our Review Pros: Commission-free stock, ETF, and options trades (no options contract fees on equity options). User-friendly platform packed with powerful charting and advanced tools. Instant funding up to $1,000. Fractional share investing starting at $5. Offers crypto and futures trading (futures available at low fees). Paper trading available for practice without risking real money. Cons: Crypto trading requires a separate app (Webull Pay). Limited account types (Lacks 529 plans, custodial or self-employed accounts). Interest on uninvested cash requires a minimum $25,000 or Webull Premium. Our Take: Webull is a solid choice for beginner and active traders who want a simple, powerful platform with commission-free trading and advanced tools. Although it lacks mutual funds and some account types, Webull’s customizable design and rich trading features make it a great option for those focused on trading stocks, options, and ETFs. Vanguard: Best for Retirement Investing InvestLane Rating: 4.8 /5 OPEN AN ACCOUNT on Vanguard’s website QUICK FACTS Fees: $0 per trade Account Minimum: $0 Promotion: None no promotion available at this time Our Review Pros: Commission-free stock and ETF trades. Low-cost Vanguard mutual funds and ETFs. Earn interest on uninvested cash. Strong retirement planning resources and access to advisory services. Fractional shares available for Vanguard ETFs through dollar-based investing. Cons: Fractional shares are generally limited to Vanguard ETFs, not individual stocks or most non-Vanguard ETFs. Some Vanguard mutual funds still require minimum investments, often around $1,000–$3,000 depending on the fund. Limited support for active traders and day trading. Research tools and trading platforms are relatively basic. Our Take: Vanguard is ideal for hands-off investors focused on long-term growth, offering a trusted, low-cost platform for building and preserving wealth despite its basic trading tools and higher fund minimums. While it lacks fractional shares and advanced features, its stability and reputation make it perfect for retirement-focused investors. Fidelity Investments: Best for Long-Term Investing InvestLane Rating: 4.9 /5 OPEN AN ACCOUNT on Fidelity’s website QUICK FACTS Fees: $0 per equity trade ($0.65 per options contract) Account Minimum: $0 Promotion: None no promotion available at this time Our Review Pros: Wide variety of investment products and account types, including fractional shares and automated features. Commission-free stock, ETF, and options trades ($0.65 per options contract). Earn competitive interest rates on uninvested cash. Strong customer service available through phone and 24/7 via chat. Professional and robo-advisory options available. Highly rated mobile and desktop platforms. Cons: No futures trading available. No paper trading or simulation tools. Broker-assisted trades can be costly. Our Take: Fidelity is a trusted, cost-effective brokerage that simplifies investing for both beginners and seasoned investors. With powerful research tools and a great customer support, you’ll always have the guidance you need. It’s an excellent choice if you want a reliable partner to help grow your wealth for the long term. Interactive Brokers: Best for Advanced traders InvestLane Rating: 4.6 /5 OPEN AN ACCOUNT on IBKR’s website QUICK FACTS Fees: $0 per trade (up to $0.65 per options contract, 0.12-0.18% crypto) Account Minimum: $0 Promotion: None no promotion available at this time Our Review Pros: Access to 160+ global markets and 18,000+ mutual funds. Low-cost stock, ETF, and options trading with tiered pricing. Powerful trading platforms such as Trader Workstation and GlobalTrader app. Competitive margin rates among the lowest in the industry. Wide-ranging research and educational resources. Fractional shares and automatic dividend reinvestment. Cons: Complex platform may overwhelm beginners. High minimum to earn interest on uninvested cash. Our Take: Interactive Brokers offers global markets, low fees, and advanced trading tools, making it ideal for experienced investors. While beginners may find it complex, its margin rates and flexible accounts suit serious, cost-conscious traders. Robinhood: Best for Simple Investing InvestLane Rating: 4.6 /5 OPEN AN ACCOUNT on Robinhood’s website QUICK FACTS Fees: $0 per trade Account Minimum: $0 Promotion: 1 free stock after linking your bank account (stock value range $5.00-$200) Our Review Pros: Commission-free stock, ETF, crypto, and options trading. Clean, beginner-friendly platform and mobile-first design. IRA with up to 3% match for Gold
Best Cryptocurrency Exchanges and Platforms for October 2026

The cryptocurrency market has matured significantly, but regulatory changes and security risks make choosing a trustworthy crypto exchange more important than ever. Whether you’re buying your first Bitcoin or trading derivatives, the right platform can make a major difference. Centralized exchanges now process trillions of dollars in annual trading volume, making platform selection a priority for beginners and experienced traders alike. In this guide, we break down the best crypto exchanges for October 2026 using our rating methodology, which evaluates platforms across more than 20 factors, including security, fees, supported assets, and overall usability. Best Crypto Exchanges & Platforms for October 2026: Top Places to Buy and Trade Cryptocurrency Which Crypto Exchange or Platform Is Right for You? Coinbase: Best Overall Crypto Exchange InvestLane Rating: 4.8 /5 OPEN AN ACCOUNT on Coinbase’s website QUICK FACTS Fees: 0-3.99% varies based on payment method and order type. Account Minimum: $0 Promotion: Up to $2,000 when you buy at least $50 in crypto. Our Review Pros: Offers a wide range of cryptocurrencies for trading and investing. User-friendly platform with an intuitive interface and mobile app. Secure, regulated, and trusted exchange. Easy to start investing with a very low minimum. Coinbase One, a subscription service with perks like lower trading fees and enhanced account benefits. Cons: Trading fees can be high and vary depending on how you buy or sell crypto. Some features, like staking, may not be available in all regions. Our Take: Coinbase is a strong choice for beginner and intermediate crypto investors who want a simple, accessible, and credible platform. Its ease of use, broad crypto selection, and reputable track record make it an excellent starting point for anyone entering the crypto market, while still offering enough tools for growth over time. Gemini: Best for Beginners InvestLane Rating: 4.7 /5 OPEN AN ACCOUNT on Gemini’s website QUICK FACTS Fees: 0.03% – 3.49% varies based on payment method and order type. Account Minimum: $0 Promotion: Get $20 in Bitcoin after trading $100 or more within 30 days Our Review Pros: Offers a solid selection of cryptocurrencies for trading and investing. Beginner-friendly platform with an intuitive interface and mobile app. Highly secure and regulated exchange. Easy to start investing with no minimum requirements. Advanced trading features available through Gemini ActiveTrader for experienced users. Cons: Trading fees can be high depending on order type and platform used. Some features, like staking or advanced tools, may not be available in all regions. Our Take: Gemini is an ideal platform for crypto investors, offering a clean, intuitive interface and mobile app that make it easy for beginners to start trading, while Gemini ActiveTrader provides advanced tools for experienced users, delivering flexibility and functionality for investors at every level. SoFi Crypto: Best for Brokerage Investing InvestLane Rating: 4.5 /5 OPEN AN ACCOUNT our partner QUICK FACTS Fees: 1% per trade Account Minimum: $0 Promotion: Up to $1,000 Offer valid from 7/20/26 through 9/10/26 for New SoFi Crypto Members Only. Our Review Pros: Buy, sell, and hold 25+ cryptocurrencies, including Bitcoin, Ethereum, and Solana. Offered through the first and only national chartered bank allowing retail crypto trading—adds an extra layer of regulatory safeguards. All-in-one app: manage crypto, banking, investing, and borrowing in a single platform. Instant trading when using funds from SoFi Checking and Savings—no transfer delays. Beginner-friendly mobile and desktop experience with in-app crypto education. Reputation for offering strong welcome bonus offers. Cons: Users cannot withdraw crypto to external wallets. Smaller coin selection compared to dedicated crypto exchanges. Flat 1% fee on all crypto buy and sell transactions, built into the displayed price. Our Take: SoFi Crypto is a strong option for beginners and long-term holders who want exposure to crypto without juggling multiple platforms. With access to 25+ cryptocurrencies on a federally regulated banking platform, it blends crypto investing with modern banking convenience. SoFi Crypto shines for simplicity, security, and its seamless integration. Robinhood Crypto: Best for Brokerage Investing InvestLane Rating: 4.4 /5 OPEN AN ACCOUNT on Robinhood’s website QUICK FACTS Fees: $0 per trade (network fees still apply for transfers) Account Minimum: $0 Promotion: None no promotion available at this time Our Review Pros: Offers a variety of cryptocurrencies for trading and investing. Beginner-friendly platform with a simple, intuitive interface and mobile app. Easy to start investing with no account minimum. Integrated with Robinhood’s platform for a combined investing experience. Cons: Users cannot withdraw crypto to external wallets. Limited selection compared to larger crypto exchanges. Advanced trading features are minimal compared with professional exchanges. Network fees on transfers apply. Our Take: Robinhood Crypto is best for beginner investors who want a simple and accessible way to trade cryptocurrencies alongside stocks and ETFs. While it does not function as a full crypto exchange and has limited coin selection and advanced tools, its user-friendly platform and commission-free trading make it a convenient option for casual crypto investors. Uphold: Best for Multi-Asset Trading InvestLane Rating: 4.5 /5 OPEN AN ACCOUNT on Uphold’s website QUICK FACTS Fees: 0-3.99% varies based on payment method and order type. Account Minimum: $1 Promotion: None no promotion available at this time Our Review Pros: Supports a large variety of cryptocurrencies, altcoins, and tokens. User-friendly interface across both mobile and web platforms. Allows seamless trading between crypto and other asset types. Provides advanced tools and charting options for experienced investors. Transparent operations with strong regulatory oversight in multiple regions. Cons: Trading fees can be high depending on order type and platform used. Some features and tokens may not be available in all regions. Limited educational resources compared with other major exchanges. Our Take: Uphold is a solid choice for crypto investors, offering a wide range of cryptocurrencies and tokens for trading and investing. Users can access major coins like Bitcoin and Ethereum, as well as a variety of altcoins and emerging tokens, giving you the ability to build diverse crypto portfolios within a single platform. Interactive Brokers: Best for Brokerage Investing InvestLane Rating: 4.4 /5 OPEN AN ACCOUNT on IBKR’s website QUICK FACTS Fees: Up to 1% of trade value.
Best CD Rates for October 2026: Up to 4.50% APY

Let’s be honest, interest rates are still high, and with the prospect of those same interest rates headed lower in the near future, many people are turning to certificates of deposit (CDs) to lock in a guaranteed return. CDs are a tool that investors use to lock up their money for a fixed period of time, with a guaranteed return for that fixed term. CDs deliver solid growth, with the protection of the FDIC. But how exactly do they work under the hood? First, we highlight the best CD rates for October 2026, so you can see where your money could be most effectively placed. Below, we explain how CDs work, how interest is credited, how penalties apply, and simple strategies (like laddering) to stay flexible, along with InvestLane’s take on CD nuances that many investors may not know. » Why trust InvestLane? See how we rate our top CD accounts. Best CD Rates for October 2026: Up to 4.50% Which Certificate of Deposit (CD) Is Right for You? Sallie Mae InvestLane Rating: 4.9 /5 OPEN AN ACCOUNT on Sallie Mae’s website QUICK FACTS Annual Percentage Yield (APY): 4.50% As of the post date updated for the listed term length. Term Length: Up to 60 months Additional term lengths vary by account. Min. Deposit: $2,500 Our Review Pros: Competitive APYs across multiple term lengths. FDIC insured up to $250,000. Easy online account setup and management. Cons: No no-penalty or bump-up CD options. Limited physical branch access (online-only). Our Take: Sallie Mae CDs offer solid rates and easy access with a low minimum deposit, making them an attractive choice for savers who prefer a fully online experience. Their competitive APYs make them ideal for savers wanting a straightforward, easy way to stay in the savings lane and grow funds steadily. Bread savings InvestLane Rating: 4.9 /5 OPEN AN ACCOUNT on Bread Savings website QUICK FACTS Annual Percentage Yield (APY): 4.50% As of the post date updated for the listed term length. Term Length: 18 months Additional term lengths vary by account. Min. Deposit: $1,500 Our Review Pros: Competitive APYs across a range of CD terms. No monthly fees. FDIC insured up to $250,000. Cons: Higher minimum deposit required ($1,500). Online-only bank, no branch access. Our Take: Bread Savings CDs combine competitive rates and straightforward terms, making them a strong choice for savers seeking consistent returns. Bread’s online-only platform offers a secure and efficient way to lock in reliable yields. Marcus by Goldman Sachs InvestLane Rating: 4.8 /5 OPEN AN ACCOUNT our partner QUICK FACTS Annual Percentage Yield (APY): 4.40% As of the post date updated for the listed term length. Term Length: 12 months Additional term lengths vary by account. Min. Deposit: $500 Our Review Pros: Competitive APYs across a wide range of term lengths. Low $500 minimum deposit. Rate guarantee if rates rise within 10 days of funding. Backed by Goldman Sachs, a trusted global financial firm. FDIC insured up to $250,000. Cons: Online-only access, no branch banking. Our Take: Marcus by Goldman Sachs offers competitive CD rates, low minimums, and a range of term options suited for different savings goals. While it lacks branch access, its trusted reputation, clear terms, and easy online management make it a strong choice for both new and experienced savers. Discover InvestLane Rating: 4.7 /5 OPEN AN ACCOUNT on Discover’s website QUICK FACTS Annual Percentage Yield (APY): 3.85% As of the post date updated for the listed term length. Term Length: 12 months Additional term lengths vary by account. Min. Deposit: $0 Our Review Pros: Competitive APYs across a wide range of term lengths. No minimum deposit required to open. Flexible terms ranging from short to long-term CDs. Backed by Discover Bank, a well-established national institution. FDIC insured up to $250,000 per depositor. Cons: No physical branches for in-person service. Limited CD tools in the mobile app. Our Take: Discover Bank CDs offer reliable, fixed-rate returns with flexible term options and no fees, making them a strong choice for savers seeking stability and simplicity. The online-only experience is straightforward and secure, and with FDIC insurance and trusted backing, Discover remains a dependable option for long-term savings goals. CIT Bank InvestLane Rating: 4.6 /5 OPEN AN ACCOUNT on CIT Bank’s website QUICK FACTS Annual Percentage Yield (APY): 3.90% As of the post date updated for the listed term length. Term Length: 11 months Additional term lengths vary by account. Min. Deposit: $1,000 Our Review Pros: No penalty to access funds if needed before maturity (must wait until after the first 7 days). No opening or maintenance fees. Easy access to your account 24/7 on your computer or with the CIT Bank mobile app. Daily compounding interest to maximize your earning potential. FDIC insured. Cons: Minimum opening deposit of $1,000 required. Regular CIT Bank CDs with longer terms generally offer lower interest rates. Online-only access, no branch banking. Our Take: CIT Bank’s No-Penalty CD allows flexible access to your funds, though term options are limited. Regular longer-term CDs have lower interest rates. With a $1,000 minimum and daily compounding, CIT Bank CDs are a solid choice for secure and flexible savings, though only select options are recommended. Valley Direct InvestLane Rating: 4.6 /5 OPEN AN ACCOUNT on Valley Direct’s website QUICK FACTS Annual Percentage Yield (APY): 4.10% As of the post date updated for the listed term length. Term Length: 6 months Additional term lengths vary by account. Min. Deposit: $500 Our Review Pros: Industry-leading APY with no minimum balance required. Backed by Valley National Bank (established 1927, FDIC member). No monthly maintenance fees or hidden charges. 24/7 online and mobile access with clean user interface. Funds are FDIC insured up to $250,000. Cons: $500 minimum to open. No physical branches or in-person support. Limited financial tools or budgeting features in app. Our Take: Valley Direct offers top savings products, with no fees and no minimums after the initial $500 deposit. It is a simple account designed for savers who want strong earnings without complexity. It does lack extras like ATM access or budgeting tools, but if you want a safe place to park cash and earn solid interest while investing long term, it is a standout choice. Barclays InvestLane Rating: 4.7 /5 OPEN AN ACCOUNT on Barclays’ website QUICK FACTS Annual Percentage Yield (APY): 4.25%
Best Crypto IRA Accounts for October 2026

Today, you can open a crypto IRA from your phone in minutes and buy bitcoin and hundreds of other coins inside a tax-advantaged account. But fees vary widely, and some platforms have failed or frozen withdrawals. Our 10-factor rating system focuses on what matters most: how safely your crypto is held and what you really pay. We ranked the best crypto IRAs on safety, fees, account options, coin selection, and track record. Compare our top picks below to find the right fit and start building your crypto retirement savings today. » Why trust InvestLane? See how we rate our top IRA accounts. Best Crypto IRA Companies for October 2026 Which Crypto IRA Account Is Right for You? iTrustCapital: Best Overall Crypto IRA InvestLane Rating: 4.7 /5 OPEN AN ACCOUNT on iTrustCapital’s website QUICK FACTS Fees: 1% per trade, no monthly fees. Account Minimum: $1,000 Cryptocurrencies Available: 100+ Promotion: $100 Bonus when you first get started and fund an account. Our Review Pros: No monthly or annual fees, no startup fees, no storage fees, and no transfer or exit fees. Uses Fortis Bank as a qualified custodian, with Coinbase Custody, Fidelity Digital Assets, and Fireblocks as storage partners, plus commercial crime insurance. 100+ cryptocurrencies, 10,000+ stocks and ETFs, plus gold and silver on one platform. Cons: Requires $1,000 to open an account, which may be a barrier if you want to start small. Every crypto buy or sell carries a 1% fee, which adds up for frequent traders. You can’t choose your custodian or hold your own private keys. Our Take: iTrustCapital is a strong pick for long-term investors who want crypto in a tax-advantaged IRA without paying monthly fees. It’s best for buy-and-hold investors, where frequent traders and those starting with less than $1,000 may want to look elsewhere. Bitcoin IRA InvestLane Rating: 4.5 /5 OPEN AN ACCOUNT on Bitcoin IRA’s website QUICK FACTS Fees: 2% per trade and 0.08% monthly fee ($20 minimum). Account Minimum: $1,000 Cryptocurrencies Available: 80+ Promotion: Up to $1,000 Bonus For new users based on the amount they fund into their account. Our Review Pros: No setup or deposit fees. Crypto is held with BitGo Trust as the qualified custodian, and the custody partner offers up to $250 million in insurance. A full team of in-house phone specialists, and you can schedule a call with an IRA specialist. Cons: Every buy or sell in a crypto IRA carries a 2% fee. A monthly custody fee of 0.08% of your asset value, with a $20 monthly minimum. That’s about 0.96% a year, which gets expensive as your account grows. Leaving is costly: closing your account costs $300, and moving crypto out in-kind costs 1% of the coins transferred. Our Take: Bitcoin IRA is a good fit for investors who value strong security and hands-on phone support, and who don’t mind paying for it. Its trading and monthly fees are among the highest in the industry, so cost-conscious buy-and-hold investors will usually do better with a lower-fee provider. Public Crypto IRA InvestLane Rating: 4.4 /5 OPEN AN ACCOUNT on Public’s website QUICK FACTS Fees: 1.25% on trades over $500, and a 0.05% monthly fee. Account Minimum: $0 Cryptocurrencies Available: 40+ Promotion: 1% Match on your annual contributions, with an IRA on Public. Our Review Pros: Earn a 1% match on your annual IRA contributions, plus an uncapped 1% match on IRA transfers and 401(k) rollovers. Matched funds must stay in the account for at least 5 years to avoid an early removal fee. More than 40 coins, including Bitcoin, Ethereum, Solana, and XRP. Advanced trading tools, including limit, stop, and stop-loss orders, recurring buys, and full crypto charts with built-in indicators. Cons: Two layers of fees: a transaction fee on each trade, plus a custodial fee based on the crypto held in your IRA. Reported rates are a 1.25% markup on trades over $500 and a 0.05% monthly custodial fee (about 0.6% a year). Far fewer coins than Alto offered before Public acquired it. Some former Alto customers have reported that coins Public didn’t support were sold during the transition. Customer service gets mixed reviews, with complaints about slow responses on Trustpilot and the BBB. Our Take: Public Crypto IRA is a strong pick for investors who want active trading tools and a 1% match on contributions and rollovers. The match helps offset its trading and custody fees, but buy-and-hold investors with large balances should compare total costs carefully. Fidelity Crypto IRA InvestLane Rating: 4.3 /5 OPEN AN ACCOUNT on Fidelity’s website QUICK FACTS Fees: 1% per trade, no monthly fees. Account Minimum: $0 Cryptocurrencies Available: 4 Promotion: None no promotion available at this time. Our Review Pros: No fees to open or maintain the account, and no custody fees. Your crypto is held by Fidelity Digital Assets, National Association, a federally chartered national trust bank, backed by one of the largest names in investing. No account minimum, and you can trade with as little as $1. Cons: Only four coins: Bitcoin, Ethereum, Litecoin, and Solana. You can’t transfer crypto into or out of the account, so leaving Fidelity means selling your crypto first. Not available in California or Oregon. Our Take: Fidelity Crypto IRA is a great pick for investors who want to hold Bitcoin or Ethereum directly in a retirement account, with no account fees and a trusted name behind it. It’s especially convenient for existing Fidelity customers, but investors who want a wide range of coins, or the option to move their crypto elsewhere later, may find it too limited. Swan Bitcoin IRA InvestLane Rating: 4.0 /5 OPEN AN ACCOUNT on Swan’s website QUICK FACTS Fees: 1% per trade and a 0.02% monthly fee ($20 minimum). Account Minimum: $0 Cryptocurrencies Available: Bitcoin Only Promotion: None no promotion available at this time. Our Review Pros: No setup, Roth conversion, account closure, distribution, or transfer fees. Available to U.S. residents 18 and older in all states, including New York and Texas. IRA clients get Swan Private, with personalized service, research, and events. Transfers or rollovers over $50,000 get a personal guide through the whole process.
Best Accounts for Robo-Advisors: 2026 Top Picks

The premise of robo-advisors is that they build your investment portfolio, rebalance it automatically, and optimize taxes while you sleep. But here’s the question few people are asking: Do you actually need to pay management fees for something you could learn to do on your own? You see, the difference between paying 0.40% annually versus 0.10% might seem small, but over 30 years, we’re talking about six figures. New investors may benefit from robo-advisors at the beginning, but over time, it may be a good idea to learn the skills to manage your investments on your own. We’re not here to tell you whether robo-advisors are right for you or not. We’re here to give you the honest breakdown so you can decide if they’re worth it for your specific situation. Best Accounts for Robo-Advisors: 2026 Top Picks Which Robo-Advisor Is Right for You? Wealthfront: Robo-Advisor InvestLane Rating: 4.9 /5 OPEN AN ACCOUNT Our partner QUICK FACTS Fees: 0.25% management fee Account Minimum: $500 Promotion: Get a $50 bonus when you fund your first taxable investment account Our Review Pros: New users may earn a cash bonus when you open and fund a new account. Automated rebalancing and tax-loss harvesting. Supports retirement, 529 plans, and more. Advanced tools for goal setting and portfolio building. Ability to borrow with a Portfolio Line of Credit (taxable accounts). Cons: $500 minimum to start. Our Take: Wealthfront stands out as a top robo-advisor with low fees, automated tax-loss harvesting, and powerful financial planning tools, making it ideal for hands-off investors. Acorns: Robo-Advisor InvestLane Rating: 4.5 /5 OPEN AN ACCOUNT on Acorn’s website QUICK FACTS Fees: $3-$12 per month Account Minimum: $0 Promotion: Get a $20 bonus when you make your first recurring investment. Terms apply. Our Review Pros: New users may earn a cash bonus when you open and fund a new account. Diversified portfolios tailored to your goals. Automatically invests spare change by rounding up purchases. Start investing with just $5 (no minimum balance required). Cons: Monthly fees can be high for small balances. Some features require higher-tier plans. Does not offer tax-loss harvesting. Our Take: Acorns is great for beginner investors who want a simple, automatic way to save and invest over time. While other platforms may offer more advanced features, Acorns remains a solid choice for those just starting out. Stash Automated Investing InvestLane Rating: 4.4 /5 OPEN AN ACCOUNT on Stash’s website QUICK FACTS Fees: $12 per month Account Minimum: $0 Promotion: Get a $25 bonus when you open a personal brokerage account and deposit at least $5. Terms apply. Our Review Pros: New users may earn a cash bonus when you open and fund a new account. Combines investing on your own with automated portfolio management. No minimum balance requirement ($5 required to get started). Cons: Monthly fees can be high for small balances. Does not offer tax-loss harvesting. No automated management for IRAs. Our Take: Stash is a solid pick for beginners seeking flexible, low-cost investing with educational support. While it lacks advanced tools, it’s a solid option for learning and growing at your own pace. Robinhood Strategies InvestLane Rating: 4.6 /5 OPEN AN ACCOUNT on Robinhood’s website QUICK FACTS Fees: 0.25% management fee Account Minimum: $50 Promotion: None no promotion available at this time Our Review Pros: Professionally managed portfolios with ETFs and U.S. stocks. Includes automated rebalancing and tax-loss harvesting. Goal-oriented tools and helpful portfolio insights. Low $50 minimum to start investing. Cons: Some features require a paid Gold membership. Our Take: Robinhood Strategies offers low-cost, automated investing with a mix of ETFs and stocks, making it great for hands-off investors. While it lacks advisor access, it’s a strong option for those looking to join the Robinhood ecosystem. Betterment: Automated Investing InvestLane Rating: 4.9 /5 OPEN AN ACCOUNT Our partner QUICK FACTS Fees: 0.25% or $4/month Account Minimum: $10 $0 minimum balance Promotion: Earn up to $1,000 when you open and fund an account. Terms apply. Our Review Pros: New users may earn a cash bonus when you open and fund a new account. Automated rebalancing and tax-loss harvesting. Themed portfolios and goal-based tools. Start with just $10. No minimum balance required. Cons: No direct indexing offered. Our Take: Betterment’s low fees, themed portfolios, automated rebalancing, and tax-loss harvesting for all accounts make it one of the top robo-advisors for investors at any level. While the premium plan includes financial advisors, its higher fees and required minimum may not suit everyone. Fidelity Go InvestLane Rating: 4.5 /5 OPEN AN ACCOUNT on Fidelity’s website QUICK FACTS Fees: 0%–0.35% management fee Account Minimum: $0 Promotion: None no promotion available at this time Our Review Pros: Free portfolio management on balances under $25,000. Transparent planning and advice offerings. Seamless integration with other Fidelity accounts. Low barrier to entry with just a $10 minimum to start investing. Cons: Does not offer tax-loss harvesting. Above market fees for accounts above $25,000. Our Take: Fidelity Go offers free management on smaller accounts and a wide range of investment options to consider. While it lacks tax-loss harvesting and charges 0.35% on larger balances, it remains a solid option to consider for long-term investors who value the Fidelity ecosystem. SoFi Robo-Advisor InvestLane Rating: 4.5 /5 OPEN AN ACCOUNT on SoFi’s website QUICK FACTS Fees: 0.25% management fee Account Minimum: $50 Promotion: None no promotion available at this time Our Review Pros: Access to human financial planners. Smooth integration with SoFi’s top-rated high-yield savings account. Low $50 minimum to get started. A range of portfolio themes offers. Cons: Does not offer tax-loss harvesting. Unlimited access to financial planners requires SoFi Plus. Our Take: With one free call to a financial planner, access to a range of themed portfolios, and clear insight into the securities provided, SoFi’s robo-advisor stands out as a strong choice for beginner investors looking for a simple, guided way to get started. Vanguard Digital Advisor InvestLane Rating: 4.8 /5 OPEN AN ACCOUNT on Vanguard’s website QUICK FACTS Fees: 0.15% annual estimate Account Minimum: $100 Promotion: None no promotion available at this time Our Review Pros: Low advisory fees (zero for your first 90 days). Automated rebalancing and tax-loss harvesting. Goal-based planning and premium investing
Markets This Week: 5 Things to Watch (Sept. 28–Oct. 2, 2026)

This week is full of exciting developments in the markets. This week’s note covers some of the top economic developments in the United States, Europe, China, and Japan, and also covers major earnings announcements. 1. New Employment Data There will be multiple pieces of labor market data released in the markets this week. Weekly jobless claims on Thursday at 8:00 a.m ET Unemployment rate and average monthly earnings data on Friday at 8:30 a.m ET Latest data from August showed a surprise rebound in labor market activity, as the economy added 162,000 new jobs and the unemployment rate remained at 4.1%.1 US weekly jobless claims also fell to a new low last week, indicating a stronger labor market.2 However, Investors should still watch for new data, especially since consumers are struggling with ongoing inflation and higher interest rates. » Start investing today: Explore top brokerage accounts with our detailed review 2. Q3 2026 Growth Estimates New Q3 2026 growth estimates will also be released this week on Wednesday at 8:30 a.m. ET. A recent survey from the Philadelphia Federal Reserve Bank projects that the US economy will grow by 2.2% in Q3 2026, notably higher than previous estimates.3 This would represent a massive recovery from growth in previous quarters and could spark more optimism in the markets this week.4 This is an important metric to monitor, as investors have been very cautious about recent rate hikes, the inflationary outlook, and long-term global growth prospects. 3. Consumer Sentiment Investors should also keep a close eye on consumer stocks, as new consumer data points will be released in the markets this week. Below are some of the major reports to keep an eye on: Consumer confidence data released on Tuesday, September 29th at 10:00 a.m ET Personal income and consumer spending data on Wednesday, September 30th at 8:30 a.m ET Average hourly earnings on Friday, October 2nd at 8:30 a.m ET According to recent data from McKinsey, consumer sentiment has remained steady relative to Q2 2026.5 Nevertheless, this data is very important to monitor, as ongoing geopolitical tensions and inflationary concerns have put pressure on US consumers. The iShares US Consumer Staples ETF (IYK) has still pulled back by 6% this year on broader macro concerns. » Ready to invest for retirement? Check out our review on the top IRA accounts 4. Global Macro News It’s also important to monitor key economic developments in other global markets this week, including Japan, Europe, and China. Date New Economic News Monday September 28th China industrial profits data Tuesday September 29th Australia’s Central Bank will make a decision about interest rates Japan Leading Indicators Data Wednesday September 30th China’s manufacturing and non-manufacturing PMI data will be released Germany’s retail sales data will be released Thursday October 1st Japan will release new CPI data The Tankan Manufacturing Index for Q3 2026 will be updated in Japan Friday October 2nd The EU will release the Harmonized Index of Consumer Prices The OECD recently lifted global growth projections to 2.9% amid ongoing geopolitical and macro concerns.6 Be on the lookout for new inflation and rate hike data in other markets, as this could result in lower growth in the global economy this year. 5. Earnings to Watch This Week Below are some of the top earnings releases for this week, which include dominant financial, hospitality, tech, and consumer giants. Earnings Release Schedule Jefferies Group Monday, September 28th after the market closes Carnival Corporation Tuesday September 29th before the market opens Micron Technology Wednesday, September 30th after the market closes Accenture Thursday, October 1st before the market opens Nike Thursday, October 1st after the market closes Earnings results from major tech companies like Micron Technology and Accenture could have a spillover impact on other tech equities. » Stay ahead of your finances: Join our free newsletters today
VT vs. VTI & VXUS: The Best Way to Own the Whole World Market

What Is VT? Can one ticker really buy you the whole stock market? That is the promise behind the Vanguard Total World Stock ETF (VT). Buy VT and you hold a long position in stocks across North America, Europe, the Pacific and emerging markets, in one line. Two funds reach substantially the same stocks, so the question is the packaging cost. Start with the case for owning a single ETF. What’s Inside VT: Holdings and Index The Vanguard Total World Stock ETF is a world stock index fund wrapped as an ETF, and Vanguard tracks the index rather than picking stocks. This ETF owns 10,088 common stocks and has $102 billion in net assets.1 Its sixth-largest holding is Taiwan Semiconductor Manufacturing, at 1.52%. Inside the FTSE Global All Cap Index The idea behind the fund is to track the FTSE Global All Cap Index, a market index reaching large-, mid- and small-cap stocks across developed and emerging countries. Breadth is the point: a world stock index fund built from big names alone skips thousands of smaller stocks. Because it is designed to track the performance of the FTSE Global All Cap Index rather than beat it, your investment return is that minus costs. Why Market Capitalization Sets the Weights Market capitalization decides where your money goes. Bigger company, bigger slice, and nobody at Vanguard votes on it. VT’s median market cap ran $159 billion as of August 31, 2026, so the middle of the fund is large even though the index reaches down the size scale. The U.S. dominates by market cap, not by anyone’s choice. » Holding other funds too? You may want to check how much two funds actually overlap. Expense Ratios Compared The table you see above does the work. VT charges 0.06%, VTI 0.03%, VXUS 0.05%, and the net assets column shows where the market has voted. » Want the U.S. comparison? See how VTI compares with an S&P 500 fund. What the Expense Ratio Costs You On $10,000, a 0.06% expense ratio costs you just $6 a year. VTI’s 0.03% costs $3. Build the two-fund version at roughly 63% U.S. and 37% international and your blended expense ratio comes in near 0.037%, saving about $2 a year. Real, but small. The fund you hold through a rough decade counts for a lot more. How Much International and Emerging Markets Exposure You Get “International” covers several very different markets, and the Vanguard Total International Stock ETF (VXUS) shows it: Europe 36.38%, Pacific 28.46%, emerging markets 26.21%, as of August 31, 2026.2 VT bundles those same stocks of companies into one equity holding at 37.7% foreign. Owning the second fund is what puts that split under your control. Most of it is boring in the best way: the companies located in Europe and the Pacific are household names that behave like U.S. large-cap stocks. How Much of the World Is Emerging Markets Emerging markets are 9.96% of VT and 26.21% of VXUS. Both are correct: VT dilutes emerging markets with its U.S. allocation, while VXUS is built ex-U.S. Want more than 10%? The two-fund build lets you dial it directly, and with VT you would bolt a separate emerging markets fund on top. See other international ETFs worth knowing. » Start investing today: Explore top brokerage accounts with our detailed review What Is VTI? (Vanguard Morningstar Total Stock Market ETF) On July 29, 2026, Vanguard renamed VTI, formerly the Vanguard Total Stock Market ETF, to the Vanguard Morningstar Total Stock Market ETF. It tracks the Morningstar U.S. Total Market Index, previously called the CRSP U.S. Total Market Index.3 Morningstar rebranded the index family and Vanguard followed, saying the changes “will not affect the funds’ investment objectives or how they are managed.”4 VTI holds 3,507 stocks at 0.03% with $2.3 trillion in net assets, close to the whole U.S. stock market in a ticker. Curious how many ETFs a portfolio really needs? How the VTI + VXUS Two-Fund Portfolio Works You buy a U.S. market ETF (VTI) and an international one (VXUS) and set the ratio. VT fixes it at whatever global market capitalization says today. Run VTI and VXUS side by side and you control it, at the cost of rebalancing by hand once a year, which can add to your return or cut it. Add a bond fund for the three-fund build. Where VTI Fits VTI is the U.S. leg and does the heavy lifting: 3,507 stocks, 0.2% foreign holdings, a $348.3 billion median market cap. Pair VTI with VXUS at roughly 63/37 and your combined holdings number about 12,300, against VT’s 10,088. The two track different index universes, which is where the difference comes from. » Ready to invest for retirement? Check out our review on the top IRA accounts Where Each Build Belongs at Tax Time Here the two builds stop being identical. Foreign governments withhold tax on the dividends these funds receive, and the IRS says that if you “paid or accrued foreign taxes to a foreign country or U.S. possession and are subject to U.S. tax on the same income,” you may be able to claim a credit or a deduction.5 Being subject to U.S. tax on the same income is why the credit reaches you in a taxable account and not inside an IRA. A second condition decides which fund can hand it to you: the credit passes through only when “more than 50% of the value of the Fund’s assets consists of securities of foreign corporations” at year end.6 VXUS, at 99.0% foreign, clears it. VT, at 37.7%, does not, so a VT holder never sees the credit in any account. That puts a long position in VXUS in the taxable account, where it can lift your net investment return. See a momentum-tilted international fund. Pros and Cons of Owning Only VT Both columns are real. What you get What you give up One holding, no rebalancing Control of the U.S. and international split Automatic reweighting as markets move Tax
Markets This Week: 5 Things to Watch (September 21-25, 2026)

The stock market is poised for another eventful week following ongoing geopolitical tensions and a new rate hike decision from the Federal Reserve. Key market news to watch this week includes new manufacturing, labor market, and real estate data, along with sector-level developments. 1. Tech Stocks One important sector to continue following in the markets this week is the technology sector. Two recent areas of concern include the Federal Reserve’s decision to hike interest rates, as well as the discourse from major AI companies about slowing down AI developments.1 Any additional geopolitical shocks could increase concerns about inflation, potentially triggering a sector sell-off. Moreover, rising US Treasury yields have recently reached a high not experienced since 2007, which may prompt some investors to rotate out of equities into safer options.2 The iShares Technology ETF (IYM) has been very volatile this year, but has still rallied by around 28.6%. » Start investing today: Explore top brokerage accounts with our detailed review 2. Manufacturing PMI Investors should also keep an eye on the US Flash Manufacturing PMI data, which will be released on Wednesday, September 23rd at 9:30 a.m ET. The US manufacturing sector has begun to show initial signs of a slowdown. Manufacturing activity fell last month, after seven previous months of increases.3 While AI investments have continued to pour in, supporting new infrastructure developments, it has not been enough to offset weakness in other areas.4 Keep an eye on various manufactured ETFs this week, including the iShares U.S. Manufacturing ETF (MADE) and the Vanguard Industrials ETF (VIS). 3. Labor Market Updates There will also be new weekly jobless claims data released in the markets this week on Thursday, September 24th at 9:30 a.m ET. Previous data was very favorable, although it was slightly overstated because of the holiday impact.5 The unemployment rate has also remained steady at 4.1%, which was one of the data points that supported the Federal Reserve’s decision to hike interest rates. One important factor to note is that labor market activity has been inconsistent across various areas of the economy. For example, food services and accommodations job growth experienced similar weakness as it did in 2020, while healthcare and social assistance has continued to drive labor market growth.6 » Ready to invest for retirement? Check out our review on the top IRA accounts 4. New Home Sales Another important area of the market to watch is the real estate sector. New home sales data will be released at 10:00 a.m ET on Thursday, September 24th. The real estate industry has begun showing signs of a cooldown, and pending home sales data recently fell by around 4% YoY in August.7 Pending Home Sales Monthly Data One additional concern in the industry is that mortgage rates will increase following the Fed’s rate hike decision. The 30 year mortgage rate recently approached 7%, which may put more pressure on potential new home buyers.8 Be sure to keep an eye on how real estate equities respond to these macro tensions. The Vanguard Real Estate ETF (VNQ) has declined by around 6% in the past month due to these weaker conditions. 5. Consumer Stocks Consumer stocks may also have an eventful week, as consumers face increased pressure from rising inflation and interest rates. There are several major consumer equities that will be releasing earnings in the markets this week. Company Earnings Release Date YTD Return Autozone Tuesday September 22nd before the market opens -15.8% Costco Thursday September 24th after the market closes 3.8% General Mills Wednesday September 23rd before the market opens -21.8% These results may provide more insights into the sentiment for consumer staples and consumer discretionary stocks. » Stay ahead of your finances: Join our free newsletters today
Best Checking Accounts of 2026

Almost every American you meet will have a checking account; it’s the primary way for people to send and receive money. Times have changed, and with interest rates still high and Fintech exploding, checking accounts in 2026 are quietly becoming one of the most important pieces of your personal-finance setup. Below, we review everything you need to know about checking accounts and how to choose the right one for you. Best Checking Accounts of 2026 Which checking account is right for you? SoFi Checking and Savings: Best Overall InvestLane Rating: 4.9 /5 LEARN MORE on SoFi’s website QUICK FACTS APY: 0.50% Earn full APY with no min. balance and direct deposit required. Promotion: Earn up to $400 when you open a SoFi Checking & Savings account by 12/31/26. Terms apply. Our Review Pros: No monthly fees or minimum balance requirements; no overdraft fees with qualifying coverage. Early direct deposit: get your paycheck up to 2 days early. Access to 55,000+ ATMs through the Allpoint network. Integrated budgeting, saving, and financial tracking tools via the SoFi app. Extra FDIC insurance provided through SoFi’s partner banks. Cons: No physical branches for in-person banking. Certain features, like check ordering, are limited or app-based. Our Take: SoFi Checking & Savings is a top-tier all-in-one account for anyone who wants flexible checking alongside a competitive savings option. With no monthly fees and easy access to your money, it outperforms most traditional banks, especially if you set up direct deposit. While it lacks physical branches and a few traditional features, it is a sleek, high-reward choice for those looking to simplify their banking and stay on track toward smarter money habits. Ally Spending Account InvestLane Rating: 4.9 /5 LEARN MORE on Ally’s website QUICK FACTS APY: 0.10% to 0.25% No monthly maintenance fees, overdraft fees, or minimum balance to earn interest. Promotion: None no promotion available at this time. Our Review Pros: No monthly maintenance fees, overdraft fees, or minimum balance requirements. Get paid up to 2 days early with eligible direct deposit. Access to over 75,000 fee-free ATMs nationwide, plus up to $10 per statement cycle in ATM fee reimbursements. Earn interest on checking balances and add cash for free at participating Walmart locations. Includes budgeting tools, cash flow tracking, credit monitoring, and built-in overdraft protection options. Cons: No physical branch locations for in-person banking. Checking account APY is modest compared with many high-yield savings accounts. Some services, including outgoing wires and expedited debit card delivery, carry fees. Our Take: Ally Bank Spending Account is one of the strongest online checking accounts, offering no monthly fees, broad ATM access, and helpful digital banking tools. Features like early direct deposit, ATM fee reimbursements, cash deposits at Walmart, and budgeting tools make it a convenient choice for everyday banking. While its interest rate is modest and it has no physical branches, Ally is a great option for users who prefer online banking with minimal fees and strong flexibility. Chime Online Checking Account InvestLane Rating: 4.8 /5 LEARN MORE on Chime’s website QUICK FACTS APY: 0% Promotion: None No promotion available at this time. Our Review Pros: No monthly fees, overdraft fees, or minimum balance requirements. Get paid up to 2 days early with direct deposit. SpotMe® feature covers overdrafts up to $200 (eligibility required). Fee-free access to 60,000+ ATMs via the Allpoint® network. Instantly block your card and get real-time transaction alerts. Easy-to-use mobile app with slick design and budgeting tools. Cons: No physical branches for in-person support. Mobile check deposit is only available after direct deposit is set up. No joint accounts or business banking options. Cash deposits can only be made through third-party retailers (may charge fees). Our Take: Chime’s checking account is built for people who want modern banking with no hidden fees. The ability to get paid early, avoid overdraft charges, and manage everything from your phone makes it a strong choice for everyday banking. While it’s not ideal if you prefer in-person service or need more advanced features, Chime delivers big value for anyone who wants to simplify their money and stay in the lane toward smarter spending. Current Spending Account InvestLane Rating: 4.7 /5 LEARN MORE our partner QUICK FACTS APY: 0% Promotion: Earn a $75 Bonus When you set up a direct deposit of $200 or more using code PAYROLL75. Our Review Pros: Get paid up to 2 days early with eligible direct deposit. Paycheck Advance feature lets you access up to $750* before payday (fees may apply). No monthly fees or minimum balance requirements. Fee-free access to 40,000+ ATMs nationwide. Easy-to-use mobile app with budgeting tools and real-time alerts. No credit check required for Paycheck Advance eligibility. Build credit option available with Current Build secured credit card. Cons: No physical branch locations for in-person banking. Paycheck Advance may include fees for instant access. Cash deposits may require third-party retailers. Limited traditional banking features compared to larger banks. Our Take: Current is a modern mobile banking app built for flexibility and fast access to your money. Features like early direct deposit, fee-free ATM access, and Paycheck Advance make it especially useful for people living paycheck to paycheck or wanting more control over timing cash flow. While it lacks physical branches and some traditional banking features, Current stands out as a strong all-in-one spending account for users who prefer mobile-first banking and quick access to funds. Alliant Checking Account InvestLane Rating: 4.5 /5 LEARN MORE on Alliant’s website QUICK FACTS APY: 0.25% $0 min. balance required for APY Promotion: None No promotion available at this time. Our Review Pros: No monthly maintenance fees. High interest rates compared to traditional checking accounts. Access to a large ATM network with fee rebates. User-friendly mobile app with useful features like mobile check deposit. No minimum balance required to open. Free online bill pay and eStatements. Cons: Limited physical branch locations. Some fees apply for out-of-network ATM withdrawals before rebate. No joint accounts available online (requires phone or in-branch). No cash deposit
Markets This Week: 5 Things to Watch (September 14-18, 2026)

There are plenty of new developments ahead in the markets this week, which could result in additional volatility. Most notably, the Federal Reserve is poised to announce updates to its interest rate policy amid heightening inflationary concerns. 1. Oil Price Surge Oil prices have increased strongly this month due to rising tensions in the Middle East. Traffic in the Strait of Hormuz has continued to stall, and the Houthis recently gained control of the Port of Mocha in Yemen.1 The price of crude oil topped $100/barrel last week, and could move higher if supply-side shocks continue in the markets this week.2 The Vanguard Energy ETF (VDE), which has rallied around 46% YTD, could experience additional volatility this week amid new geopolitical developments. » Start investing today: Explore top brokerage accounts with our detailed review 2. US Rate Decision One of the most important events in the markets this week will likely be the Federal Reserve’s decision on interest rates. The Federal Reserve will make this decision on Wednesday at 2 p.m ET. Inflation remained unchanged at 3.4% last month, but the Federal Reserve will also have to consider the impact of recent energy price shocks.3 The recent Jobs report was also very strong, which may also put pressure on the Fed to hike rates, especially if inflation looks like it will increase in September and subsequent months.4 Sectors like technology could be some of the top market movers this week if there are meaningful policy updates. 3. Global Macro Updates This week will also be very eventful in other global markets, as many Central Banks will make interest rate policy decisions.5 The Bank of England and Bank of Japan will also make new interest rate policy decisions on Thursday and Friday, respectively. Investors will likely be closely following all of these developments, as a massive push for rate hikes could spark concerns about the Federal Reserve’s success in keeping inflation in check. Moreover, widespread rate hikes could also result in slower global growth projections. The latest projections from the International Monetary Fund (IMF) are calling for 3% global growth, but lingering economic and political risks could result in growth downgrades and other economic shocks.6 » Ready to invest for retirement? Check out our review on the top IRA accounts 4. Retail Sales Investors should also be on the lookout for new U.S. retail sales data, which will be released on Wednesday at 8:30 a.m ET. Last month’s report was a bit concerning, as retail sales dipped following stronger performance in May and June.7 Inflation has lingered at 3.4% in recent months, and any additional energy price shocks would weaken consumer sentiment in subsequent months. The VanEck Retail ETF (RTH) has pulled back by nearly 7% in the past month on the back of these broader macro fears. 5. Real Estate Data The real estate industry will also have a lot of exciting news released this week. The Pending Home Sales Index will be released on Thursday at 10:00 a.m ET, and Housing Starts data will also be released on Thursday at 8:30 a.m ET. Investors should continue to monitor the recent industry cooldown, as home sales recently fell by 2% in August.8 Moreover, the upcoming interest rate decision from the Federal Reserve this week could also strongly impact the real estate industry. The average mortgage rate in the United States recently rose to 6.85%, the highest rate since June 2025.9 Keep an eye on leading real estate ETFs, such as the iShares US Real Estate ETF (IYR) and the Vanguard Real Estate ETF (VNQ). » Stay ahead of your finances: Join our free newsletters today
The 5 Best Gold ETFs of 2026 (My #1 Pick and Why)

Why Gold ETFs Belong in a Portfolio Owning gold used to mean owning the metal. You buy coins or bars, then you deal with storage. Insurance costs money every year. Selling later means finding a dealer and taking whatever price they quote that day. Gold ETFs trade all of that for convenience. You buy shares in a normal brokerage account or an IRA, the fund tracks bullion, and shares are traded whenever the stock exchanges are open. Many investors use gold to protect a portfolio against inflation and the kind of market stress where stocks and bonds fall together. That is the whole case. You never hold a single ounce yourself. And if you are deciding where a specific $1,000 should go, we answered that question on its own page. » Start investing today: Explore top brokerage accounts with our detailed review How Physical Gold Funds Work A share of a physically backed gold ETF is structured as a claim on real metal in a vault. It is not a futures contract or a debt security, which is where confusion about precious metals funds starts. The trust buys physical gold, stores it, and issues shares against what it holds. Price tracks the metal closely after fees. Nothing about the structure is complex, so cost ends up being the main thing separating one gold ETF from another. Two gold ETFs holding the same physical gold differ mostly by what they charge. » New to the structure? Our guide on how to invest in ETFs covers the mechanics. What Gold Bullion Backing Means Gold bullion backing has one wrinkle worth understanding before investors buy shares. The trust pays its expenses by selling a small amount of the metal it holds, month after month. So the gold bullion behind each share slowly declines, even on a day when the price does nothing. Nothing is hidden about the process. It is the honest version of the line that gold pays no dividends, so there is no income to tax while you hold. The 5 Best Gold ETFs of 2026 Here are the five, in order of size. Four of them hold physical gold and one holds miners. For a sense of how these funds rank across the whole market, see the largest ETFs in the market by assets. SPDR Gold Shares (GLD): Best for Active Traders GLD launched on November 18, 2004, the first US gold ETF and still by far the largest, with $145.98 billion in assets under management as of August 12, 2026.1 Size is the product here. It carries a large listed options market for investors who trade around a position. Its own 30-day median bid/ask spread is 0.01%. You pay 0.40% a year for that, the highest expense ratio of the four physically backed funds. On $10,000, for example, that is $40 annually. For a trader moving in and out, $40 is noise against execution quality. Investors holding twenty years see that $40 compound against them, even when the returns underneath are compounding too. That is why the rest of this list exists. iShares Gold Trust (IAU): The Lower-Cost Alternative IAU arrived two months after GLD, on January 21, 2005, second largest here at $65.01 billion in total assets. The sponsor fee is 0.25% against GLD’s 0.40%.2 Same $10,000, and now the cost is $25 a year instead of $40. Its own 30-day median bid/ask spread is 0.01%. For most investors that combination of a lower expense ratio and heavy trading has been enough. IAU was the default answer among gold ETFs for years. Then the newer minis showed up and undercut it. SPDR Gold MiniShares (GLDM): Best for Long-Term Investors State Street runs GLDM alongside GLD, holding the same metal under the same structure, at a gross expense ratio of 0.10%.3 That is a quarter of GLD’s fee. On $10,000 you pay $10 a year. GLDM launched June 25, 2018 and now holds $30.39 billion, so the cheap option stopped being the small option a while ago. Its own 30-day median bid/ask spread is 0.01%. Run that fee difference against GLD across thirty years and the advantage stops looking cosmetic. This is the fund I point investors toward when they are buying gold and have no plans to touch it. VanEck Gold Miners (GDX): Mining Company Exposure GDX is a different animal. Buying it buys 66 gold mining companies, not gold.4 Miners carry operating costs, debt, country risk and management decisions that a bar of metal never has. When gold prices run, good miners tend to run harder. A company with a bad quarter can still fall while the metal holds steady. The fee is 0.51%, highest in this lineup, on $27.99 billion in total net assets. The top 10 holdings are 61.53% of the fund, so this is a concentrated stock position wearing a commodity label. It pays a small distribution too, which no physical gold fund does. Read it alongside how many ETFs you actually need first. iShares Gold Trust Micro (IAUM): The Lowest Expense Ratio IAUM carries the lowest expense ratio on this page at 0.09%, one basis point under GLDM.5 On $10,000 that works out to $9 a year against GLDM’s $10. The saving is real. It is also one dollar. IAUM launched June 15, 2021, the newest of these top gold ETFs, and at $7.47 billion the smallest. Its own 30-day median bid/ask spread is 0.02%. None of that is a warning to investors. It is a shorter record with less size behind it. If the cheapest possible number is what you want, this is the one. How the Top Gold ETFs Compare Fund Issuer Expense Ratio Net Assets Inception SPDR Gold Shares (GLD) State Street 0.40% $146B November 18, 2004 iShares Gold Trust (IAU) iShares 0.25% $65B January 21, 2005 SPDR Gold MiniShares (GLDM) State Street 0.10% $30B June 25, 2018 VanEck Gold Miners (GDX) VanEck 0.51% $28B May 16, 2006 iShares Gold Trust Micro (IAUM) iShares 0.09% $7B June 15, 2021 Net assets as of
6 Best Small-Cap ETFs to Buy in 2026

Why Small Cap Stocks Earn a Place Beside Your US Equities You already own the big companies. If your portfolio holds an S&P 500 index fund, the bottom rung of American business is missing or weighted so lightly it rounds to nothing. Start with the arithmetic. On a $100,000 portfolio a 5% small cap sleeve is $5,000. Enough to move your return in a year when small cap stocks run, small enough that a 30% drawdown is minimal and can be recovered. All six funds below returned more than 32% over the trailing twelve months ended June 30, 2026. The appeal is diversification with an economic basis under it. Investors who own only an S&P 500 fund miss small cap stocks entirely, and the risk profile is why many hesitate. Small cap stocks can earn revenue differently than mega cap stocks, carry more debt sensitivity, and respond to domestic demand rather than a global sales mix, which your US equities capture. Size the sleeve for the drawdown, not the rally. Volatility cuts both ways, and the same volatile swing that lifts these stocks 40% takes it back. Before you invest a dollar, settle how many ETFs you need. » Start investing today: Explore top brokerage accounts with our detailed review What Counts as a Small Cap Stock Ask three index providers what a small cap stock is and you get three different answers. That settles which stocks end up in your small cap ETF. The cleanest answer comes from the Russell 2000. At the April 30, 2026 rank day, the market cap breakpoint separating large caps from small caps rose 24% to $5.7 billion, and its smallest company carried a market cap of $146.4 million.1 So within the Russell 2000 the market cap range representing small cap stocks runs from roughly $146 million to $5.7 billion. Any fixed dollar cutoff ages badly. A rule of thumb you learned as “under $2 billion” was true against a different market cap range and stopped being true. Total market capitalization drifts upward and the small cap index redraws its boundary. FTSE Russell now reconstitutes the Russell US indexes semi-annually, changed from annual effective 2026. Set that beside what the S&P 500 actually holds and the contrast drives everything below. The 6 Best Small Cap ETFs, Compared The six best small cap ETFs on one page, with the metrics that decide most choices. ETF iShares Core S&P Small-Cap ETF (IJR) iShares Russell 2000 ETF (IWM) Avantis US Small Cap Value ETF (AVUV) Vanguard Morningstar Small Cap Growth ETF (VBK) Avantis International Small Cap Value ETF (AVDV) Invesco S and P SmallCap Momentum ETF (XSMO) Index S&P SmallCap 600 Russell 2000 Actively managed Morningstar US Small Cap Growth Actively managed S&P SmallCap 600 Momentum Inception 5/22/2000 5/22/2000 9/24/2019 1/26/2004 9/24/2019 3/3/2005 Net Assets $112B $82B $29B $25B $19B $3B Expense Ratio 0.06% 0.19% 0.25% 0.05% 0.36% 0.36% Holdings 671 1,965 792 544 1,717 108 Top Ten % 7.32% (6/30) 3.42% 8.54% 9.3% 8.15% 24.28% 30-day SEC Yield 1.48% (7/31) 1.14% 1.21% 0.39% 2.64% 0.69% Past Year 37.42% 40.59% 39.00% 32.73% 34.63% 38.60% 3 year Avg. 15.98% 18.44% 19.06% 17.46% 26.06% 25.41% 5 year Avg. 7.30% 6.86% 12.29% 5.37% 13.81% 12.30% 10 year Avg. 11.47% 11.53% Not applicable 12.16% Not applicable 15.50% All returns are NAV basis, standardized, average annual, for periods ended June 30, 2026. Now the part comparison tables get wrong: more holdings is not automatically more diversification. IWM holds 1,965 stocks against IJR’s 671, and the two are not nested sets. Different indexes, different breakpoints, different entry rules, and IWM’s holdings reach further down the size and liquidity scale, where trading costs run higher. The bigger number is a poor guide to risk. Core Exposure: The Cheapest Core Small Cap ETF on the List IJR is the plain core small cap ETF here. It tracks the S&P SmallCap 600, held 671 stocks on August 12, 2026, and charges 0.06%.2 Investors underrate this. On $10,000, 0.06% costs $6 a year against $19 for IWM. Compounding can work on your returns or on your costs, so across thirty years the cheaper small cap ETF keeps more of whatever its index delivers. The top ten holdings account for 7.32% of assets on June 30, 2026, unconcentrated by any normal standard, though IWM’s wider net puts its top ten at 3.42%. One caution: the largest is a BlackRock cash fund at 1.96%, so these are the ten largest holdings, not the ten largest companies. IJR’s 30-day SEC yield was 1.48% on July 31, highest of the four that print one. Small cap dividends are not the reason to own this category, though a fraction of your return arriving as cash makes volatile years easier. Start with how to invest in ETFs. Broad Exposure: Every Small Cap the Russell Can Hold IWM is the small cap ETF most investors picture and owns more stocks than anything else here, holding 1,965 positions on August 12, 2026, tracking the Russell 2000.3 So does owning 1,965 companies buy anything the 671 do not? Some, and less than the count suggests. The Russell 2000 takes approximately the 2,000 smallest securities by market cap and index membership, with no profitability screen, so IWM owns companies that would fail the S&P SmallCap 600 screen at the point of addition. That widens the range of outcomes rather than raising the return you should expect. IWM led these funds at 40.59% over one year and trailed IJR over the five-year performance window, 6.86% against 7.30%, on the same inclusion policy. The fee is 0.19%, three times IJR’s, for a small cap ETF that tracks a looser small cap index. Those costs can compound the way returns do, only against you. Value: Where Profitability Meets Price AVUV is actively managed and does not seek to replicate an index.4 That sentence makes some investors close the tab. Active does not have to mean a hunch. Avantis emphasizes smaller stocks trading at low prices relative to book value, weighted
Markets This Week: 5 Things to Watch (August 17-21, 2026)

There are plenty of important pieces of economic data that will be released in the markets this week. Some of the main updates include weekly jobless claims, manufacturing and services data, existing home sales updates, and earnings results for major consumer companies. 1. Additional Federal Reserve Discourse The Federal Reserve will release its July FOMC meeting minutes on Wednesday at 2 p.m ET. This will be one of the most crucial pieces of information released this week, as rate hikes are one of the main hot topics in the markets at the moment. Inflation recently rose to 3.4% YoY in July, largely due to the reduced shock of energy prices during that month.1 US Inflation Rate The Federal Reserve previously voted 9-3 to leave rates unchanged during its last policy meeting.2 Equities have rallied strongly recently due to the reduced fear of rate hikes and energy price shocks. However, inflationary risks have heated up in recent days as oil prices have risen considerably in the past week. » Start investing today: Explore top brokerage accounts with our detailed review 2. Jobless Claims Jobless claims have continued to rise in recent weeks, most recently exceeding the weekly average by 10,000.3 New weekly jobless claims data will be released on Thursday at 8:30 a.m. ET. Although the labor market has remained relatively healthy, this is still an important metric to monitor in the coming months. Additional weaker labor market data could also support the Fed’s ongoing decision to delay rate hikes for the time being.4 Gold mining equities may also continue to respond to labor market data, as they have in recent weeks. The VanEck Gold Miners ETF has rallied by 18% over the past month amid economic and geopolitical fears. 3. Services and Manufacturing Data S&P will release new flash services and manufacturing PMI data on Friday at 9:45 a.m ET. While data from July was very strong, exceeding analysts’ expectations, this is still an important area to monitor as supply-side and inflationary risks linger. Recent sources of growth have been mixed, as stronger consumer spending and AI-related investments helped support growth in Q2 2026.5 However, there is still a lot of uncertainty in other manufacturing sectors, and the United States’ exports have been facing pressure amid new geopolitical risks. Another important piece of broad macro data to monitor is the US leading indicators, which will be released at 10:00 a.m ET on Thursday. This data includes a health check on leading economic and financial indicators, including S&P 500 performance, real estate data, labor market data, and new manufacturing orders. » Ready to invest for retirement? Check out our review on the top IRA accounts 4. Real Estate Updates Investors should also keep an eye on new data in the real estate industry. Existing home sales fell to a new low in July, and the market is beginning to display signs of a cooldown.6 There will be a wide variety of new data released that impacts the industry, including the following: NAHB Housing Market Index released at 10:00 a.m ET on Monday Housing starts released on Tuesday at 8:30 a.m ET Pending home sales released on Tuesday at 10:00 a.m ET Be sure to monitor real estate ETFs like the Vanguard Real Estate ETF (VNQ), which could experience some volatility this week. 5. Earnings Updates This week will also be an eventful earnings release week for major consumer companies, including Home Depot, Lowe’s Corporation, Target, and Walmart. Company Earnings Release Home Depot Tuesday August 18th before the market opens Lowe’s Corporation Wednesday August 19th before the market opens Target Wednesday August 19th before the market opens Walmart Thursday August 20th before the market opens Earnings results from these companies will provide more data about consumer health, inflationary risks, and overall sentiment in the US economy. Consumer discretionary and staples stocks could be some of the strongest market movers this week if these earnings releases are eventful. Keep a close eye on ETFs like the Vanguard Consumer Staples ETF (VDC) and the Vanguard Consumer Discretionary ETF (VDX). » Stay ahead of your finances: Join our free newsletters today
Best Bitcoin ETFs in 2026: Which Fund Is Right for You?

We selected the five largest Bitcoin ETFs that hold Bitcoin directly and have competitive expense ratios, using fund data available in August 2026. The Five Leading Bitcoin ETFs, Compared Fund (ticker) Sponsor fee Net assets 30-day median spread Bitcoin custodian iShares Bitcoin Trust ETF (IBIT) 0.25% $48.4B 0.03% (Aug 7) Coinbase Custody Trust Company, LLC* Fidelity Wise Origin Bitcoin Fund (FBTC) 0.25% $10.8B 0.04% (Aug 6) Fidelity Digital Assets, National Association Grayscale Bitcoin Mini Trust ETF (BTC) 0.15% $3.8B 0.04% (Aug 7) Coinbase Custody Trust Company, LLC* Bitwise Bitcoin ETF (BITB) 0.20% $2.4B 0.03% (Aug 6) Coinbase Custody Trust Co., LLC ARK 21Shares Bitcoin ETF (ARKB) 0.21% $2.2B 0.05% (Aug 6) Coinbase Custody Trust Company, LLC; BitGo Bank & Trust, N.A.; BitGo New York Trust Company, LLC; Anchorage Digital Bank N.A. *IBIT and BTC each name Anchorage Digital Bank N.A. as an additional bitcoin custodian. IBIT’s prospectus describes it as an available alternative rather than a concurrent one. What a Spot Bitcoin ETF Actually Is For simplicity, many call these products Bitcoin ETFs. They hold Bitcoin directly, giving investors exposure to Bitcoin without having to buy or store it themselves. Technically, these products are structured as commodity trusts, not traditional ETFs. They are regulated by the SEC and must meet federal securities laws, but they do not follow all of the rules that apply to conventional ETFs and mutual funds under the Investment Company Act of 1940. That means they have different requirements around areas such as custody and valuation.1 The SEC approved spot Bitcoin ETFs in January 2024 but made clear that the approval did not endorse Bitcoin itself. No share is insured by the Federal Deposit Insurance Corporation or any other governmental agency. Bitcoin itself is a commodity under the Commodity Exchange Act, and the CFTC keeps general anti-fraud and manipulation authority over virtual currency cash markets, while saying its oversight of those cash markets is limited.2 Share Price and Net Asset Value Are Two Numbers Net asset value is struck once each business day against a reference index, and that index price is the official mark. The price of bitcoin moves overnight and at weekends while the shares do not, because, as we mentioned previously, these funds trade during exchange hours and bitcoin trades 24/7. Authorized participants create new shares when demand rises, redeeming them in blocks called Baskets, and that arbitrage keeps the market price close to net asset value.3 It’s worth noting that discrepancies still appear. In secondary markets the market price is whatever the last buyer paid, so a premium raises what you pay and a discount cuts what you receive. What counts is the change between the premium or discount you buy at, and the one you sell at. Share prices stay closely tied to the price of bitcoin. Closely tied, but not identical. Why Spot Funds Replaced Bitcoin Futures Futures bitcoin ETFs track derivative futures contracts instead of holding real bitcoin. Those futures contracts expire and roll forward, which creates tracking differences and can cut returns when later-dated contracts trade above spot bitcoin. Spot funds hold bitcoin itself in secure regulated storage and track bitcoin more cleanly than bitcoin futures did. Mutual funds transact at the next calculated net asset value once a day; unlike mutual funds, a Bitcoin ETF trades all session on its listing exchange, which for these five means the Nasdaq, NYSE, or Cboe. The 2x Bitcoin Strategy ETF uses futures to target twice a daily return, resets that target every day, and is not a spot fund. » Start investing today: Explore top brokerage accounts with our detailed review Picking the Best Bitcoin ETF for How You Invest Three questions can easily sort a Bitcoin ETF shortlist: how long you hold, how much you move, and who holds the bitcoin. The best Bitcoin ETF for a trader is rarely the best Bitcoin ETF for a buy-and-hold type investor. iShares Bitcoin Trust ETF: Built for Size The most traded Bitcoin ETF is the iShares Bitcoin Trust ETF, which held $48.42 billion on August 7 at a 0.03% median bid/ask spread, with 30-day average volume of 35,697,747 shares.4 It alone publishes a standardized volume figure, so the group runs on median spreads, and it ranks among the largest ETFs in the market. Strength: by far the largest fund here, and the only one publishing average volume, so you can size an order against real data. Limitation: 0.25% ties it for priciest, and BITB matches its spread for less. BTC and BITB: Cheapest to Hold Grayscale’s Mini Trust charges 0.15% against $3.83 billion at a 0.04% median spread.5 Bitwise charges 0.20% against $2.41 billion at 0.03%. It publishes the bitcoin represented by each share an a daily basis and commissions independent proof-of-reserve examinations.6 Strength: BTC’s management fees cost $15 a year on $10,000 against IBIT’s $25, and BITB matches IBIT’s spread for less. Limitation: both are smaller than IBIT, so check live spreads and book depth and use a limit order for size. FBTC and ARKB: Who Holds the Coins Fidelity charges 0.25% and held $10.81 billion as of July 31, 2026 at a 0.04% median spread.7 Its bitcoin is held by Fidelity Digital Assets, a sponsor affiliate rather than an outside firm. ARK 21Shares charges 0.21% against $2.23 billion at 0.05%, the widest here.8 Its latest 10-Q names four custodians across three organizations.9 Four of the five use Coinbase Custody, and three of those four also name Anchorage Digital Bank. Only FBTC uses neither. ARKB lists the longest roster and does not disclose how its bitcoin is allocated among them, so a longer list of custodians tells you less than it appears to do. Fees Against Spreads, and Why Holding Period Decides This is where most Bitcoin ETF comparisons go south. Management fees recur every year you hold; the spread is a one-time trading cost. Which dominates depends on time. On $10,000, IBIT’s 0.25% costs $25 a year against BTC’s $15. BTC’s spread is one basis point wider, roughly $1 per
Markets This Week: 5 Things to Watch (August 10-14, 2026)

There will be multiple events that will impact the markets this week, most notably the release of new inflation data. There will also be several key earnings results releases for companies operating in the healthcare, mining, and technology industries. 1. Real Estate Market The real estate market has faced headwinds in recent months due to rising inflation and the potential for further rate hikes. One important piece of data to follow in the markets this week is the existing home sales data, which will be released on Tuesday, August the 11th at 10:00 a.m ET. Sales fell by 2.4% in June, so this is important data to follow.1 Despite these industry tensions, REITs have had very strong returns this year. Some of these products yield nearly 4%, well ahead of the S&P 500.2 It may also be a good idea to closely monitor other traditional real estate ETFs this week, including the Vanguard Real Estate ETF (VNQ) and the iShares US Real Estate ETF (IYR). Both of these ETFs could be some of the stronger market movers this week. » Start investing today: Explore top brokerage accounts with our detailed review 2. July Inflation Data Wednesday will also be another very important day in the market this week, as new inflation data will be released at 8:30 a.m ET. The Federal Reserve delayed hiking interest rates and is awaiting new data about inflation developments in the United States. According to data from the Federal Reserve Bank of New York, the median inflation projection is 3.6%.3 Last month’s cooldown was largely driven by the correction in energy prices, a trend that will likely also affect July data.4 Markets could respond strongly to this new data, coupled with oil price movements, as investors continue to speculate on the potential for rate hikes in H2 2026. 3. Consumer Sentiment There will also be several important pieces of consumer data released on Friday. July retail sales data will be released on Friday at 8:30 a.m ET, while the University of Michigan preliminary consumer survey will be released at 10:00 a.m ET. Data from last month was notably weaker relative to May, as consumers continued to feel the pressure of inflation.5 Despite this weakened sentiment, select retail equities have rallied strongly in the past month. The State Street SPDR S&P 500 Retail ETF (XRT) has rallied by 3.6% in the past month, while the Amplify Online Retail ETF (IBUY) has increased by 4.8%. » Ready to invest for retirement? Check out our review on the top IRA accounts 4. New Earnings Data Although the majority of major tech and other dominant S&P 500 companies have already announced earnings, there are several important earnings releases to monitor in the markets this week. Monday August 10th Simon Property Group, Rocket Labs, and Barrick Mining Corporation Tuesday August 11th SEA Limited, Lumentum Limited, and Cardinal Health Wednesday August 12th Cisco Systems and Coherent Corporation Thursday August 13th Applied Materials, Brookfield Corporation, and NetEase Inc Friday August 14th Freedom Holding Corporation and CG Oncology Inc. As these earnings results are released, it may also be ideal to follow developments in these areas: Updates from Cisco Systems, NetEase, Rocket Lab and Applied Materials, which could have a spillover impact on sentiment for tech equities Additional financial updates from healthcare giants like CG Oncology and Cardinal Health 5. Commodities Commodities will also likely be a very important theme in the markets this week, especially since there will be new inflation data. Copper will likely be a salient theme this week, as recent supply disruptions coupled with the continued demand for electrification led to a strong price spike last week.6 Precious metals stocks also trounced the S&P 500 last week, and these stocks could be worth monitoring amid the new geopolitical and economic news released in the markets this week. Moreover, there may be continued volatility in the oil markets since the United States and Iran have failed to reach a new agreement.7 » Stay ahead of your finances: Join our free newsletters today
The Best Gold ETF to Invest $1,000 in Right Now

Gold as a Safe Haven Asset Something rattles the market. The dollar slips, inflation headlines stack up, and the cash in your savings account feels less like security than a slow leak. Gold earns its safe haven label by answering to different pressures than stocks and bonds. Governments issue debt, central banks move rates, currencies adjust against each other. Gold sits outside all of that, priced by a global market trading around the world every day. Here’s the honest version. Gold pays you nothing while you hold it, so investing in it works as diversification and as an inflation hedge rather than as the engine of your returns. That stability carries a quiet upside in a taxable account. A dividend fund gives you income every quarter, with a tax bill to match, whether you want it or not. Gold ETFs on the other hand, throw off no dividends, so year to year there is almost nothing to report. The trusts do sell a sliver of metal each month to cover expenses, which passes through as a small reportable amount, and the rest of the bill waits until you sell. That is why most investors reach for gold to protect what they already have. Before adding another position, look at how many funds a portfolio actually needs. » Start investing today: Explore top brokerage accounts with our detailed review How Gold ETFs Work Buying gold ETFs is not going to put bars in your hands. You buy shares that trade on an exchange, and a trust holds the metal for everyone who owns those ETF shares. The mechanics match how to buy your first ETF. Your account shows a ticker, not a safe. Funds That Hold Physical Gold Bullion The largest gold ETFs are trusts that own physical gold bullion, nothing else. The trust buys bars, stores them in a vault, and issues shares against those holdings. A custodian verifies the bars exist, which separates these ETFs from a promise. That structure hands you direct exposure to the actual metal. When gold rises 10%, these gold ETFs tend to track it closely, minus the annual fee. Their share price should track the metal in the vault rather than a manager’s bets on stocks. You never take delivery of physical metal, and never insure a safe. What you own is a claim on the trust’s holdings, priced live on the exchange at a market price anyone can keep an eye on. The Best Gold ETF for $1,000 Three bullion ETFs dominate, all from issuers you’ve heard of, all with identical holdings. Choosing the best gold etf for a $1,000 investment comes down to two numbers, what the trust takes each year and how heavily the fund trades. Here is where the major precious metals funds stand. The Best Gold ETF for $1,000 Issuer Fund Ticker Net assets Expense ratio Avg daily volume State Street SPDR Gold MiniShares GLDM $28.5B 0.10% 3,237,047 BlackRock iShares Gold Trust IAU $59.4B 0.25% 4,304,350 State Street SPDR Gold Shares GLD $130.3B 0.40% 4,942,316 BlackRock iShares Silver Trust SLV $28.5B 0.50% 11,490,049 VanEck Gold Miners GDX $22.6B 0.51% 13,788,568 Expense ratios and net assets come from each issuer’s fund page, as of late July 2026, and the GLDM figures are as of June 2026, the most recent State Street publishes. Volume figures are average daily share counts from the ETF data provider Stock Analysis, pulled August 4, 2026 so the whole column measures the same window of time.1 One warning on that last column. Share counts are not like-for-like, since a GLD share carries several times the dollar value of a GLDM share. Read volume as a rough signal of how crowded the exchange is around a fund. SPDR Gold Shares and the Cheaper SPDR Gold MiniShares SPDR Gold Shares is the original and still the giant among gold ETFs. It launched back in November 2004 and carries a 0.40% gross expense ratio against roughly $130.3 billion in net assets.2 That size buys enormous liquidity, and the fund shows up on every list of the largest ETFs by assets. State Street also runs a second fund on the same bullion. SPDR Gold MiniShares (GLDM) started in June 2018 and charges 0.10%. Same issuer, same metal, one quarter of the fee. For buy-and-hold money, MiniShares is the SPDR gold product to own. So a fair question is; why would anyone pay four times as much? Size does something at the trading screen that a low fee never will. The larger fund carries a heavily traded listed options market, which lets a trader write covered calls against a gold position or buy protection without hunting for a counterparty. Big orders also fill closer to the quoted price at that kind of volume. Both State Street funds post a 30 day median bid/ask spread of 0.01%, so a typical retail trade sees the same friction either way. The advantage arrives when your order is large, your timing is short, or an options chain is part of the plan. iShares Gold Trust and Its Lower Expense Ratio iShares Gold Trust sits between the two SPDR gold ETFs. IAU has run since January 2005, holds about $59.4 billion in net assets, and charges a 0.25% sponsor’s fee.3 That’s a cheaper annual charge than the original by a wide margin. IAU deserves a look when your broker offers it commission-free and leaves GLDM off the list. Check the fund page at iShares, then the page for GLDM. Comparing Expense Ratios Expense ratios look harmless on $1,000. A 0.40% fee is a cost of about $4 a year. GLDM’s 0.10% runs about $1.4 Three dollars. Who cares? You should, and here’s why. That cost happens whether the gold price rises or falls, and it repeats every year you hold the fund. On a flat $1,000 balance, the cheaper fee structure keeps roughly $30 in your account across a decade. Scale the position to $10,000 and it’s $300. The management cost is the one number you control
Markets This Week: 5 Things to Watch (August 3-7, 2026)

There will be a lot of new economic news released in the markets this week, including manufacturing, services, and employment data. Key companies in the tech and hospitality industry will also release earnings results this week. 1. Manufacturing Data The US economy’s growth came in much slower than expected in Q2 2026, partially because of weaker export growth.1 One import metric to keep an eye on is manufacturing data, which may provide more context to the growth outlook for H2 2026. One of the upcoming data releases in the markets this week is the US Manufacturing PMI, which will be released on August 3rd at 9:45 a.m ET. Tensions between Iran and the United States, which have caused an uptick in inflation, have resulted in slower growth in the United States’ traditional manufacturing sectors. This trend is worth monitoring amid the heavy AI-driven narratives in the market and economy. AI has been behind a large portion of the economy’s growth and stock market returns. Around two-thirds of GDP growth from the first half of 2025 came from new AI investments.2 » Start investing today: Explore top brokerage accounts with our detailed review 2. Services Sector Update One of the main factors that supported Q2 2026 included robust consumer spending and relatively healthy activity in the services sector.3 There will be new monthly US Services PMI data released on Wednesday, August 5th at 9:45 a.m ET. This data is well worth monitoring, as tensions between the US and Iran have begun to put pressure on the US services sector in recent months.4 Some key services-based ETFs to keep an eye on include the Vanguard Consumer Discretionary ETF (VCR) and the Vanguard Communications Services ETF (VOX). 3. Additional Labor Market Updates There will also be a lot of new labor market data released this week. Labor markets have been facing a lot of tension in recent months, as job growth has declined and the unemployment rate has remained at around 4.2%. Below are some of the top news releases to monitor this week: ADP National Employment Summary Report: Wednesday, August 5th at 8:15 a.m ET Employment/Unemployment Report: Friday, August 7th at 8:30 a.m ET Average Hourly Earnings: Friday, August 7th at 8:30 a.m ET New AI investments from companies have driven new layoffs in industries like technology. There were 245,000 layoffs in this industry last year, and total layoffs in the tech industry have already reached 170,000 this year.5 Labor market data has been gradually weakening in recent months. Nonfarm payroll growth has already been declining in recent months.6 Nonfarm Payrolls Weaker labor data could be one factor that pushes the Federal Reserve to delay rate hikes, although inflationary pressure has also put pressure on the Fed to hike rates in the near term.7 » Looking for a guaranteed income? Explore today’s top CD rates 4. Global Macro News There will also be a lot of global macro news released in the markets this week, following the US economy’s underperformance in Q2 2026. Below are some major developments to monitor in China, Japan, and the European Union. Country/Region Economic Releases China Private Manufacturing PMI on August 3rd Private Sector Services PMI on August 5th Japan Services Sector Health Report on August 3rd BOJ meeting minutes from July policy meeting on August 5th Europe Eurozone Manufacturing PMI on August 3rd This data is all worth monitoring, as any setbacks could result in growth downgrades for 2026. The World Bank is currently forecasting 2.5% global growth due to geopolitical tensions, rising commodity prices, and other economic headwinds.8 5. Important Earnings Results There have been several major exciting earnings announcements in recent weeks for major tech giants, resulting in a massive divergence in performance among US tech companies. There will also be several important earnings releases in the markets this week. Some leading names in the tech and hospitality industry will report earnings this week. Company Q2 Earnings Announcement Palantir Technologies August 3rd at market close Marriot International August 3rd at 7:00 a.m ET Advanced Micro Devices August 4th at market close Space X August 4th at 3:30 p.m ET Expedia Group August 5th at 4:30 p.m ET Airbnb August 6th at market close Key ETFs to follow this week include the Invesco Leisure and Entertainment ETF (PEJ), the VanEck Semiconductor ETF (SMH), and the Global X Defense Tech ETF (SHLD). » Stay ahead of your finances: Join our free newsletters today
The 5 Best Bond ETFs to Buy in 2026

What Fixed Income Really Buys You Ask anyone who held only stocks through the last crash what they wish they’d owned alongside them. Fixed income, every time. Bonds and stocks rarely fall together. Bonds pay you to lend. You hand over principal, the borrower sends interest payments on schedule, and bond ETFs pass that income to your account. Predictable payments separate fixed income securities from stocks. Fixed income investments are why investing through a drawdown stays survivable, and bond ETFs are how most people own bonds. The bond market has grown fast. Back in May 2022, BlackRock projected that global bond ETF assets would triple to $5 trillion by 2030, from $1.7 trillion at the time, after five years in which bond ETFs grew 23.4% a year through December 2021 against 9.5% for open-end mutual funds.1 So bond ETFs can help twice over: smooth out the ride, and the bonds keep earning income while doing it. Before buying more ETFs, you might want to check how many ETFs you actually need. How Bond ETFs and Bond Mutual Funds Differ Bond ETFs and bond mutual funds both pool cash and buy bonds. The difference is how you trade those bonds. Exchange traded funds (ETFs) price all day on an exchange, so you watch the price move. Most bond funds built as mutual funds settle once, at the closing net asset value. Bond ETFs, though, settle on the exchange in seconds, and that liquidity is the edge exchange traded funds hold over mutual funds. Here’s how to invest in ETFs if you’re new. Turnover is where the tax difference shows up. Mutual funds can distribute capital gains when managers sell securities inside the fund, creating a tax bill for investors even if they never sold their shares. The ETF structure absorbs most of that, which is why ETFs beat mutual funds on tax efficiency in a taxable account. Holdings are reported daily too, so you know exactly what you own. The Low Cost Advantage of Index Bond ETFs Cost is where low cost index bond ETFs really come out ahead. Most charge between 0.03% and 0.06% a year, which is roughly what index investing in bonds costs once a computer does the picking. Morningstar’s 2026 fee study put the asset-weighted average expense ratio across US funds and ETFs at 0.32% for 2025, roughly ten times what a low cost index bond ETF charges, and expenses like that come out of your return every year, in every market.2 Active managers earn their fee by responding to market changes, and active bond ETFs can adapt to market dislocations in real time in a way an index tracker never will. Passive index ETFs hand you thousands of bonds for almost nothing. Core-plus bond ETFs sit between the two, holding an investment grade core plus a slice of high-yield and emerging market debt. Why Bond Funds and ETFs Have No Maturity Date Here’s the misconception worth clearing up: that a bond fund matures the way a single bond does. Individual bonds do carry a maturity date and real default risk, and unless there is a default, you get your principal back on that day. Unlike individual bonds however, bond ETFs keep rolling, since the fund sells underlying securities as those bonds approach maturity and buys new bonds. The maturity date never arrives, so the net asset value and the share price float with interest rates instead. » Looking for a guaranteed income? Explore today’s top CD rates How to Match the Best Bond ETFs to One Job So which job is open in your portfolio right now? Many investors scan a list of the best bond ETFs, buy the top name, and hold bonds for a job they never really had. Investing in fixed income works when every fund has an assignment, a purpose. Five jobs, five ETFs. You don’t need all five, but understanding each role helps you choose the right bond ETF for your portfolio. Read the summary prospectus first. It tells you the fund’s investment objectives, which bonds and securities it holds, its expenses, and its risk. Ticker Job Index tracked Holdings Expense ratio Yield (30-day SEC) Duration BND Core allocation Bloomberg U.S. Aggregate 11,476 0.03% 4.61% Intermediate SGOV Parked cash ICE 0-3 Month T-Bill 23 0.09% 3.57% 0.11 years VTEB Tax-free income S&P AMT-Free Muni 10,570 0.03% 3.56% Intermediate VGIT Drawdown ballast Bloomberg Treasury 3-10 Yr 105 0.03% 4.36% 3 to 10 years VTIP Inflation protection Bloomberg TIPS 0-5 Yr 25 0.03% 2.02% 0 to 5 years All yields shown are 30-day SEC yields. Vanguard yields as of July 23 and July 24, 2026. BND and VTIP holdings as of June 30, 2026, BND net assets as of June 30, 2026. SGOV yield as of July 24, 2026, with holdings, net assets, and duration as of July 27, 2026. Expense ratios as reported on each fund’s issuer profile, most recent prospectus dates December 2025 through April 2026. » Saving for the short-term? Start with the best places to park short term cash instead. BND: The Core of a Bond Portfolio Best for: a core U.S. bond allocation. BND is the default answer for the middle of a bond portfolio. The fund tracks the Bloomberg U.S. Aggregate Float Adjusted Index, so Treasury bonds, agency bonds, and investment grade corporate bonds arrive in one ticker. Net assets sat at $159.8 billion as of June 30, 2026, the largest fund in this lineup by a wide margin.3 Cost is what investors underestimate when investing in bonds. At a 0.03% expense ratio, a $10,000 position costs $3 a year. Just three dollars. On the other hand, an actively managed bond fund charging 0.45% takes $45 annually whether the bond market rises or falls, and those expenses compound against your other investments. Pair these bond ETFs with a stock index fund and you have the simplest 3-fund portfolio. » Start investing today: Explore top brokerage accounts with our detailed review What 11,476 Holdings Actually Get You
Markets This Week: 5 Things to Watch (July 27-31, 2026)

The Federal Reserve is poised to make its long-awaited decision about interest rates this week. Beyond the Fed decision, markets will also be watching several major catalysts this week, including GDP estimates, inflation, and consumer sentiment data. 1. US Rates Decision The Federal Reserve will meet this week and announce its interest rates decision on Wednesday at 2 p.m. A CME watch tool recently raised the odds of a rate hike to 82%, up from 53% a week ago.1 This decision may have a strong spillover impact on the market, especially since investors have already been selling tech stocks due to new inflationary fears.2 Other Central Banks, such as the ECB and DOJ, have hiked rates recently in response to new inflationary pressures. Moreover, the new wave of energy inflation in the past few weeks is another new indicator that could strongly impact Central Bank policy in the coming months. » Start investing today: Explore top brokerage accounts with our detailed review 2. GDP Estimates The BEA will release new Q2 2026 growth estimates for the US economy on Thursday at 8:30 a.m. The Federal Reserve Bank of New York currently projects that Q2 2026 GDP growth will reach 2.8%.3 This will be a crucial update for markets this week, as geopolitical tensions have sparked concerns over a slowdown in global growth. GDP growth was 2.1% last quarter, and JP Morgan is currently projecting 1.5-2% growth in 2026.4 3. New Inflation Updates There will also be new inflation data released this week, which will provide more context to the recent oil price surge. The PCE Index, which measures price increases excluding food and energy, will be released on Thursday at 8:30 a.m. The recent increase in inflation in 2026 was largely driven by energy prices.5 However, the PCE Index has also been rising recently, by 4.1% in May, compared to 3.8% in the previous month.6 This uptick is slightly concerning, as it displays how items apart from energy and food are increasing in price. » Looking for a guaranteed income? Explore today’s top CD rates 4. Consumer Sentiment Updates Consumer staples stocks have rallied circa 8% YTD, but this performance was largely driven by the surge in these stocks during the first two months of this year.7 Recent geopolitical and inflationary pressures have made the current health of the US consumer market hazy. Consumer confidence data will be released on Tuesday at 8:00 a.m ET, while personal income and consumer spending data will be released on Thursday at 10:30 a.m ET. Overall, consumer sentiment has been weakening over the past three years, further exacerbated by the rebound in inflation in 2026. Consumer stocks are one key area to monitor in markets this week, as there will also be new inflation and interest rate data paired with this new consumer data. 5. Tech Stocks Earnings News The recent surge in oil prices and concerns over subsequent rate hikes have been putting pressure on tech stocks. The technology sector is likely one of the top sectors to monitor in markets this week. Major tech giants will be releasing earnings next week, around the same time as the Federal Reserve makes its rate hike decision. Company Earnings Announcement Microsoft Wednesday July 29th at 2:30 p.m ET Meta Platforms Wednesday July 29th at market close Amazon Thursday July 30th at market close Apple Thursday July 30th at market close Tech stocks pulled back by around 3% last week and may be some of the main market movers this week. » Stay ahead of your finances: Join our free newsletters today
How to Build an ETF Portfolio That Can Last a Lifetime

How to Build an ETF Portfolio That Lasts a Lifetime Imagine there is an account you open in your twenties and still trust into your sixties. That’s the goal. A portfolio you can hold on to through booms, crashes, job changes, and every headline in between, without tearing it apart each year or losing sleep over performance. Exchange traded funds (ETFs) make that staying power possible. One fund can hold hundreds or even thousands of companies, trades like a stock, and costs almost nothing to own. You get broad exposure, low fees, and a structure built for decades of growth. A good ETF portfolio holds the right mix of funds, and the right mix beats a crowded lineup every time. Plenty of experienced investors overbuild, stacking funds on top of funds. Many investors would do better with less. New to this? Our guide on how to invest in ETFs covers the mechanics. This one covers the plan. Seven steps: set your goal, choose your allocation, pick low cost core funds, add diversification where it helps, cut overlap, match your risk, and rebalance. » Start investing today: Explore top brokerage accounts with our detailed review Start With Your Financial Goals Before you buy a single fund, answer one question. What is this money actually for? Your financial goals decide everything that follows. For example, money you’ll need within a year or two has no business in the stock market. But cash you won’t touch for thirty years can ride out almost anything. For retirement, a house down the road, income later in life, or long-term growth, each goal points to a different setup. Your investment objectives set the time horizon, and the time horizon sets how much risk you can carry. Match the funds to those investment objectives. A lot of poor investment decisions start with a mismatch between goal and account. Good investment decisions begin with a clear goal. Someone saving for a wedding shouldn’t run the same investment strategy as someone forty years out. The best investing strategy is the one you stick with, and serves your end goal.. If your objective is retirement, the mix will evolve as you age. Our breakdown of the right allocation at every age shows how that glide works. Once your investment goals are clear, the rest gets much easier. » Ready to invest for retirement? Check out our review on the top IRA accounts Choose Your Asset Allocation Your asset allocation is the split between stocks, bonds, and other asset classes. It determines how your portfolio behaves more than any single fund you pick. Nail the asset allocation and the rest is just details. Stocks give you growth, and with it, volatility. Bonds on the other hand, bring stability and income. A strategy for a young investor might be to hold 90% stocks and 10% bonds. For someone near retirement, that might flip closer to 50/50. Your investment portfolio should reflect the risk you can live with, not the one that looks good on paper. Spreading across different asset classes smooths the ride. Balancing Stocks, Bonds, and Other Asset Classes Most portfolios are built from a few asset classes: US stocks, international stocks, and bonds. Some also add small slices of other asset classes like real estate or commodities. The bond side is where people get lazy. A single fund like Vanguard’s Total Bond Market ETF (BND) holds thousands of US bonds in one ticker, and its expense ratio is just 0.03%, against 0.53% for the average similar fund.1 That’s your stability sleeve, sorted. Whatever your stock allocation, a clean starting point like a simple three-fund portfolio is hard to beat. Pick Low-Cost Core ETFs With your asset allocation set, you fill it with low cost core funds. A broad index ETF is the workhorse here. Rather than pay professional managers to pick winners, you can buy the whole market for a rock-bottom fee. An index ETF just mirrors its market. Cost is the one variable you have 100% control over. Vanguard’s Total Stock Market ETF (VTI) holds the entire US market and carries an expense ratio of 0.03%, compared to 0.72% for the average similar fund.2 One holding and you own US stocks top to bottom. That fee difference looks tiny, but over a lifetime, it isn’t. How the Expense Ratio Shapes Your Net Return The expense ratio is the yearly fee a fund charges, taken straight from your return. On a $100,000 balance, a 0.03% expense ratio costs $30 a year. A 0.72% fund costs $720 for the same holding. Run that across thirty years of compounding and you’re leaving tens of thousands on the table. Index funds keep costs low, and that’s the advantage. They usually undercut actively managed mutual funds on price. Actively managed ETFs and traditional mutual funds carry higher management fees, and those fees don’t buy better results for most investors. ETFs also win on tax efficiency over comparable mutual funds, handy in a taxable account, especially for high turnover funds. Want the full comparison? See how ETFs compare to mutual funds. How to Find ETFs Worth Holding for Life To find ETFs you can hold forever, keep the checklist short. You want broad exposure, a low expense ratio, healthy volume, and an index you understand. ETFs trade all day on major stock exchanges, and a fund’s price tracks the net asset value of its holdings. Good ETFs track their index closely and stay cheap. A total-market fund built on US large cap stocks and the rest of the market covers most of it. Want the numbers in one place? Grab our free index fund cheat sheet and run any fund past it before you buy. Past performance never guarantees future results, so you may want to focus on low cost ETFs and let time do the work. Building a Diversified ETF Portfolio A diversified ETF portfolio spreads your money so no single company, sector, or country can sink you. Diversification reduces the risk of major
Markets This Week: 5 Things to Watch (July 20-24, 2026)

There are plenty of exciting developments ahead in the markets this week, including new labor market, housing, and manufacturing data. Geopolitical tensions also peaked over the weekend, and investors should keep an eye on how these developments will impact markets this week. 1. Labor Market Sentiment One of the main data points that may impact future rate hikes is an update on the health of the US labor market. Last month’s Jobs report showed weaker employment growth, as the US economy only added 57,000 new jobs.1 There will likely be additional layoff data from major tech companies this week. So far, major giants like Xbox, Robinhood, and Microsoft have already conducted major layoffs, and Google employees recently signed a petition calling for layoff protection.2 Investors should also be on the lookout for new weekly jobless claims data, which will be released on Thursday. Moreover, major tech companies are also reporting earnings data next week and may provide updates about layoffs. » Start investing today: Explore top brokerage accounts with our detailed review 2. Manufacturing PMI Data Investors should also keep an eye on the new S&P Global Flash US Manufacturing PMI data, which will be released on Friday. Manufacturing PMI in the United States recently dropped slightly to 53.9, below the initial projections of 55.7.3 Manufacturing PMI Many global markets now face the risk of slower manufacturing activity, as recent geopolitical tensions have increased input costs.4 This data, coupled with movements in energy prices, should provide more insight about growth data for Q2 2026 and subsequent quarters. 3. New Home Sales Another major sector to monitor in the markets this week is real estate, which has been experiencing a moderate cooldown. Pending home sales recently fell by 5.4% MoM and 0.3% YoY in June, according to data from the National Association of Realtors.5 The US Census Bureau and Department of Housing and Urban Development will release June 2026 new home sales data on Friday. Sales have been cooling down in recent months, and new June data could impact sentiment for real estate equities.6 The Vanguard Real Estate Index Fund ETF (VNQ) has rallied 13% YTD amid concerns over rate hikes and other broader economic concerns. » Looking for a guaranteed income? Explore today’s top CD rates 4. ECB Rate Decision Another important event in international markets this week is the upcoming ECB interest rate decision. The ECB recently decided to hike rates by 25 basis points in June to combat the new wave of inflation that hit markets.7 Euro Area Interest Rate Inflation cooled down in June, but global central banks will have to continue monitoring geopolitical developments and new inflation data in subsequent months. The ECB will make its decision about rates during its meeting this Thursday. 5. Geopolitical Tensions Geopolitical tensions took a nasty turn at the end of last week. Elevated tensions between Iran and the United States could be one of the main market movers this week. Both Iran and Kuwait recently reported attacks on their infrastructure on Friday, severely harming the progress of previous ceasefire discourse.8 Oil prices rose by more than 10% during the week due to these tensions, reaching a new monthly high.9 The Vanguard Energy ETF (VDE) rallied by 2.4% last week amid the S&P 500 decline. Oil equities may be an interesting sector to observe this week, as additional geopolitical flare-ups could continue to impact energy equities. » Stay ahead of your finances: Join our free newsletters today
ETF Overlap Explained: Is It Hurting Your Portfolio?

What ETF Overlap Really Means More funds should mean more diversification, right? That’s the instinct, anyway. You buy a handful of equity ETFs, spread your investment around, and figure you’ve covered your bases. Then you look under the hood only to find out you are not as diversified as you thought. Exchange traded funds (ETFs) are a basket of different investments, and the popular ETFs hold the same underlying securities at the top of the list. So when you hold multiple ETFs, you often buy the same companies again and again. One fund calls itself large-cap. Another calls itself growth. Pull their holdings, and the top names look strangely familiar, the same giants people refer to on any large-cap list. Even a single security like Nvidia can lead the number-one spot in several funds at once, and that one security drives more of your return than you’d think. That’s the point worth checking before you buy the next fund. And if you’re deciding between ETFs and mutual funds, the same trap applies to both. After all, one ETF can provide access to hundreds of stocks, which is great, right up until the next fund you buy holds the very same ones. Why It Happens in Mutual Funds and ETFs Alike This isn’t an ETF thing, by the way. Mutual funds do exactly the same thing. Most index funds, whether they trade as a mutual fund or an ETF, weight their holdings by company size, so the biggest companies are always going to be the ones at the top of just about every broad fund. And that means, if you buy an S&P 500 index mutual fund and an S&P 500 ETF, you’re basically buying the same thing, just with different labels. In a real sense, only the ticker changes. » Start investing today: Explore top brokerage accounts with our detailed review VOO vs VTI: Two Funds, One Portfolio Take the two most popular index ETFs around and compare VOO vs VTI directly. On paper they look like different funds with different jobs. VOO tracks the S&P 500, the 500 largest U.S. companies. VTI tracks the total U.S. market and holds 3,448 stocks, nearly seven times as many. Two mandates on paper. You’d expect two portfolios. But the reality isn’t quite so exciting. If you compare VOO and VTI at the top holdings, you’ll find they’re basically twins. And that’s because the biggest companies dominate both. Those giant names have so much weight that all the extra small caps in VTI barely even show up on the radar. The number backs it up. According to ETF Research Center, the two have an 88% overlap by total weight.1 Comparing the Top Holdings of Each Fund Here’s where it gets interesting. In VOO, the ten largest holdings make up roughly 36% of the fund, led by Nvidia at 7.89%.2 Apple sits right behind at 7.05%, then Microsoft, Amazon, and Alphabet. For example, VTI holds 3,448 stocks, yet its top ten holdings mirror VOO’s and have roughly 32% of the fund concentrated in the top ten.3 VOO vs VTI: Overlap Comparison Holdings data as of 05/31/2026. Expense ratio as of 04/28/2026. Returns/price as of 06/30/2026. Data point VOO VTI Tracks S&P 500 Index CRSP US Total Market Index Stocks held 503 3,448 Expense ratio 0.03% 0.03% Largest holding Nvidia Nvidia Largest holding weight (%) 7.89% 6.70% Top ten holdings weight (%) 36.41% 31.87% Past year return 22.34% 23.18% Past 10 year average return 15.47% 15.03% Overlap by total weight 88% 88% The stocks line up in the same order, with the weights only slightly lower in VTI due to increased holdings. The overlapping holdings at the top are what you’re really buying when you own both funds. Owning VTI on top of VOO doesn’t hand you thousands of fresh companies to spread your risk. It hands you a slightly longer tail of tiny positions, while the mega-caps you already held through VOO get another touch. For most investors chasing broad exposure, one fund tracks that market just fine. » Stay ahead of your finances: Join our free newsletters today How Overlapping Holdings Stack Up A fund holding one security, Nvidia, at 8% is fine. The trouble starts when you stack funds that all lean on the same names. Say you like growth, so you pair VOO with a growth fund and a tech fund. Now look at the overlapping holdings you own across those multiple ETFs. In VUG, the Vanguard growth ETF, Nvidia is 13.10% and Apple 12.32%, the same names that top VOO and VTI, only carrying more weight.4 VGT, the Vanguard information technology fund, goes further and puts about 42% of the fund in Nvidia, Apple, and Microsoft alone, with Nvidia at 16.78%.5 Hold multiple funds like these, and the same three companies keep leading every single one. If you want the fund-level detail, growth funds like VUG and QQQM break down cleanly, and our roundup of the best growth ETFs covers the field in a more diverse way. When Growth and Tech Funds Track the Same Giants Here’s the part that counts and you don’t want to miss. Give each of those four funds an equal 25% slice, then blend their Nvidia weights together. Nvidia’s weight alone lands at about 11% of your whole portfolio. With the second holding, apple included, it works out to be another 10% roughly. Two companies, a fifth of everything, from a portfolio you built to be diversified. No single security should run your whole portfolio like that. That’s really high overlap, and most investors don’t realize it until they add up the company weight themselves. With QQQ, the overlap barely changes, since QQQ tracks the Nasdaq-100 and tends to focus on the same mega-cap technology names. When one security tops four funds, its swings become yours. Certain stocks simply dominate every technology-heavy fund, and the same handful leads across sectors. Hold multiple ETFs that all focus on tech, and the diversification you expected turns into
Markets This Week: 5 Things to Watch (July 13-17, 2026)

Markets this week will be filled with exciting new developments, including updates on inflation, rate hike expectations, and consumer health in the economy. Geopolitical developments also took a negative turn at the end of last week, which could spill over to equity markets this week. 1. Ceasefire Issues Tensions in the Middle East will likely be front and center in the markets this week. Trump recently announced that the ceasefire deal with Iran was over, although the United States and Iran have continued to maintain a dialogue.1 Oil stocks rallied slightly last week and should be worth keeping an eye on as geopolitical developments continue in the markets this week. Chemical stocks have also benefited from supply-side tensions. Morningstar recently noted that leading chemical stocks rallied by over 20% YTD by the middle of April due to the surge in chemical prices.2 ETFs like the Vanguard Energy Index Fund ETF (VDE) and the Fidelity Select Chemicals Portfolio (FSCHX) could be worth monitoring closely this week. » Start investing today: Explore top brokerage accounts with our detailed review 2. Upcoming Inflation Data Investors should also keep an eye on new inflation data, which will be released on Tuesday, July 14. A new Federal Reserve report is calling for 3.7% inflation in June, the highest level experienced since September 2023.3 Inflation has recently peaked at a new high following tensions in the Middle East, and equity investors are cautiously monitoring whether this is a short-term shock or a long-term issue. While markets appear to have priced in inflation peaking, any ongoing geopolitical tensions and higher inflation readings would reintroduce stronger fears of a future rate hike this year. 3. Fed Reserve and Rate Hikes The Federal Reserve will present its semiannual monetary report to Congress on Tuesday, July 14, shortly after new CPI data is released. We are at a potentially crucial turning point in the market, as the Federal Reserve may need to consider rate hikes following its aggressive cuts in 2025.4 The Bank of Japan and the ECB have recently had to hike rates amid inflationary pressures, and the Federal Reserve has been facing increased pressure to follow suit.5 Once new inflation data is released, the Federal Reserve may provide more clarity about its future rate decisions. » Looking for a guaranteed income? Explore today’s top CD rates 4. Retail Sales Sentiment There will also be new consumer data released in the markets this week, including June retail sales data on Thursday, July 16, and consumer sentiment data on Friday, July 17. This data will be a strong complement to the newly released CPI data and could impact sentiment for retail and consumer stocks in the markets this week. Data from previous months was very strong, so any changes in readings in June could impact market sentiment.6 ETFs like the State Street SPDR S&P Retail ETF (XRT) currently trade at a price/earnings discount to the S&P 500 and have had solid performance in the past year. Themes like retail could have an eventful week following the combination of new inflation and retail sales data released this week. 5. Important Earnings Releases July will also be a very important month for the market because of new earnings releases in multiple sectors. One major area of the market to monitor is the financial sector, as leading US banks like Wells Fargo, JPMorgan Chase, and Bank of America will report earnings on Tuesday, July 14.7 The iShares US Financial Services ETF (IYG) has only risen by 1.5% amid broader economic and geopolitical concerns this year. Other notable earnings releases to monitor in markets this week include Netflix, UnitedHealth Group, and Abbott Laboratories. Investors should also keep a close eye on how tech and healthcare ETFs respond to upcoming earnings updates in the upcoming weeks. » Stay ahead of your finances: Join our free newsletters today
Best AI ETFs for 2026: How to Invest in Artificial Intelligence

You want a piece of the AI boom without betting everything on one chipmaker. The good news is, you can. An AI ETF holds a collection of companies tied to AI, and one share buys the whole group. You get six funds across the AI supply chain to choose from, plus some tips and tricks for comparing and choosing. These funds are geared towards long-term investors who want AI exposure but don’t want to pick single stocks. The thing is, if you get it wrong and pick the wrong fund, you’ll be paying a premium for companies you already own. The AI market has moved fast over the past few years, and the AI ETF space is getting crowded with new funds popping up all the time, from chips to AI tech in software. » Start investing today: Explore top brokerage accounts with our detailed review What Is an AI ETF? An AI ETF is an exchange-traded fund that owns shares in technology companies that are working on artificial intelligence. Think of it as getting pre-built AI stock exposure. Chipmakers, cloud providers, and generative AI developers, all in one neat package. Like other ETFs, it trades on the secondary market at a price that changes throughout the day, unlike mutual funds. New to the structure? Here is how ETFs work. Artificial intelligence ETFs give you the theme without researching the companies involved in AI development. AI ETF vs Technology ETF Here is where people slip up. A broad technology ETF and an AI ETF sound like twins. They hold the same tech stocks but aim at different things. A technology ETF targets companies across the whole tech sector. The iShares U.S. Technology ETF charges 0.38% and holds the broad U.S. tech sector, not an AI slice.1 An AI ETF narrows the lens to AI. Both own technology companies; the difference is focus. Want broad growth instead? Compare these with growth ETFs. How AI Stocks Compare to Funds Why not just buy the AI stocks directly? You can, but a fund can offer some upsides. For one thing, it can spread your risk across many AI stocks, which can cushion a single stumble. For most people building wealth over time, the fund means fewer decisions and fewer bad picks. AI ETFs and Mutual Funds You’ll also see AI mutual funds out there. The holdings can look similar, but the wrapper behaves differently. Exchange traded funds trade all day and usually cost less; mutual funds price once after the close and often charge higher fees. For a full head-to-head comparison, take a look at ETFs versus mutual funds. The bigger point though is taxes. When a fund manager trades in and out of positions often, those sales can trigger capital gains that get handed to shareholders, including people who never sold a single share. In a mutual fund, that leaves you owing tax on gains you didn’t cash out. The ETF structure sidesteps most of that, so those surprise capital gains distributions are far less likely to reach you. Chasing an actively managed or high-turnover AI fund? The ETF is the favored wrapper for it. In a taxable account, that edge adds up over time. The Types of AI Exposure Not every AI holding is a pure play. Some companies are directly exposed to demand for AI tech, like a model builder selling AI software. Others get only a little bit of exposure, a utility selling power to a data center will benefit some, even though AI isn’t its core business. A chipmaker, on the other hand, is right at the center of it, with a lot more direct exposure than that utility. When you scan an AI ETF, ask yourself what kind of exposure are you buying: pure play exposure or broader AI stock exposure? AI funds fall into a few different buckets. Some are all about the hardware: chips, memory, and the data centers that run the models. Others act like a next gen software ETF, holding the generative AI and application layer. A few even try to own the entire AI theme at once. Each bucket bets on capturing emerging growth opportunities inside AI technology as the buildout continues. 1. Semiconductors and AI Technology: SMH Chips are the foundation of AI technology, that’s why many investors start here. The VanEck Semiconductor ETF (SMH) holds 26 U.S.-listed chip names and charges 0.35%.2 Its top holdings are no surprise: Nvidia at 18.41% of the fund. The fund invests to correspond generally to a semiconductor index, tracking its price and yield performance, which sets the fund’s market price. Its 1-year return hit 150.62% as of 5/31/2026, an endpoint that flatters it, so do not bank on a repeat. See our best semiconductor ETFs. For further data on each ETF, scroll below. 2. Memory Chips: DRAM Memory is the next layer. AI models eat enormous amounts of it, and the Roundhill Memory ETF (DRAM) is pure play exposure to the memory makers that supply it.3 Its strategy is intensely concentrated, with Micron at 25.96%, and the fund’s active management gets to pick the names. The basket holds very few stocks, so expect significant volatility. Lean on a handful of names and one rough quarter from any single one can jolt the whole fund, which is the risk to keep in mind here. One catch: DRAM launched on April 2, 2026, so its record is thin. Its since-inception return of 161.51% is cumulative over roughly one quarter, not annualized, and there is no 1, 3, or 5-year data yet. With that said, the fund has currently broke the record to becoming the fastest-growing ETF to reach $20B in AUM. 3. Data Centers and Infrastructure: DTCR All that spending on AI has to live somewhere, that’s where data centers come in. The Global X Data Center and Digital Infrastructure ETF (DTCR) owns the REITs and infrastructure behind the AI technology buildout, led by Equinix at 12.30%, for 0.50% a year.4 Data centers take years to
Best ETFs for Monthly Income in a Taxable Account: SPYI & QQQI

SPYI and QQQI in a Taxable Brokerage Account Most of your retirement money probably sits in a 401(k) or IRA, and you can’t touch it without a penalty until 59½. So what do you do if you want a paycheck from your investments right now? That’s where a taxable account comes in handy. There’s no age restriction and no withdrawal penalty, so you can just pull income even in the same month you earn it. SPYI and QQQI are built for exactly that situation. Both are ETFs that throw off large distributions every month, and both can be traded in any standard brokerage account. Income focused investors can use these ETFs to generate extra income on top of a salary, while retirees can fold them into a portfolio that covers living expenses without having to sell any shares. As a yield strategy, both fit in nicely into a wider mix of investments without you having to time the market or rethink your investing plan. Here’s the appeal in plain terms. You hold the ETFs, the distributions go into your account, and you can decide whether to spend the cash or reinvest it. For someone who wants extra yield from the market today instead of decades from now, that flexibility is the whole point. But, there are some real trade-offs, and we’ll get to them. How They Pay High Monthly Income How do these ETFs deliver double-digit yields when the S&P 500 itself yields barely over 1%? The short answer is covered calls. Each fund keeps full exposure to the index it tracks, then sells covered calls against those holdings and collects option premiums in return. Picture renting out the upside on individual stocks you already own. Tenants cover the rent; option buyers cover the premium. NEOS runs a data driven options strategy, it is done by selling call options that respond to market conditions and volatility instead of writing the same call options every month. Those premiums then become the bulk of what you receive. That’s how these funds generate high monthly income that typical monthly dividend ETFs can’t match on yield alone. They deliver far more than ordinary stock dividends. So what do you give up? Selling covered calls caps your upside, which is the real risk for an investor who is growth-minded. When the index runs past the strike price, the fund keeps the premium but forfeits the gain above it. That’s basically the trade for the yield. JEPI and JEPQ made this options strategy popular, and SPYI and QQQI pushed covered calls toward even higher distributions, but more importantly, a more convenient tax structure. One tax detail is built in from the start. Because both ETFs write broad-based index options, those contracts qualify as Section 1256 contracts, which the IRS taxes as 60% long-term and 40% short-term regardless of how long the fund holds them, but that’s not even the key to their efficiency.1 Inside the NEOS S&P 500 High Income ETF (SPYI) SPYI, known as the NEOS S&P 500 High Income ETF, is the older of the two funds. It launched in August 2022 and holds around $10.1 billion today. If you are looking for S&P 500 stocks with a nice monthly check, this is the fund for that. The NEOS S&P 500 High Income ETF (SPYI) tracks the S&P 500 while writing index call options on top, so the fund holds the same 500 large-cap stocks as a conventional index fund. Its underlying exposure shows up in the top holdings, a big-tech roster: NVDA at 7.64%, AAPL at 6.77%, MSFT at 4.29%, AMZN at 3.64%, and GOOGL at 3.22% as of late June 2026. Now let’s look at income. SPYI comes with a 12.08% distribution rate, with a 12-month trailing distribution rate of 11.78%, paid monthly at a 0.68% expense ratio.2 At a share price near $52, that’s roughly $0.53 a share every month. Shares trade right at NAV, with the market price and net asset value at $52.17 and $52.16 in late June, which keeps liquidity tight and day-to-day performance nice and smooth. Performance has held up well. Since it was launched back in August 2022, the NEOS S&P 500 High Income ETF has returned about 15.33% annualized, with a one-year total return of 23.88% and a three-year mark of 17.12%. Income investors tend to hold ETFs like this in a portfolio for the cash flow, knowing past performance can’t guarantee future results and that the call-writing trades away some of that capital appreciation. » Start investing today: Explore top brokerage accounts with our detailed review Inside the NEOS Nasdaq 100 High Income ETF (QQQI) QQQI is the younger sibling and, somehow, it has already managed to become the bigger fund. The NEOS Nasdaq 100 High Income ETF launched in January 2024 and has pulled in roughly $12.6 billion in net assets, outgrowing SPYI to rank among the largest option-income funds around. Same playbook, heavier on tech. If SPYI is the steady one, then QQQI is the high-octane version. QQQI also runs the covered call strategy but this time on the Nasdaq 100 index instead of the S&P 500 index, so its underlying exposure leans harder toward technology and communication services. Top holdings as of late June 2026: NVDA at 7.86%, AAPL at 6.94%, MU at 5.27%, MSFT at 4.43%, and AMZN at 4.11%. That’s a heavier semiconductor weighting than Invesco QQQ holders might expect, and it’s the reason why QQQI carries higher volatility than its S&P 500 cousin. The income runs hotter too. QQQI posts a 14.11% distribution rate, with a 12-month trailing distribution rate of 13.56%, paid monthly at the same 0.68% expense ratio.3 The share price right now is at $55, with the market price and NAV both at $54.94 in late June, giving you deep liquidity at a clean entry point. Performance since the January 2024 inception date has been strong: about 22.16% annualized, with a one-year return of 30.99%. The NEOS Nasdaq 100 High Income ETF is too young for a
Markets This Week: 5 Things to Watch (June 29–July 3, 2026)

Some of the major trends to monitor in markets this week include new employment data in the United States and a potential roadblock to peace agreements between the United States and Iran. There will also be several economic data reports released this week that will focus on specific sectors in the US economy, as well as economic conditions in the European Union and Japan. 1. New Employment Data The U.S. BLS will release new labor market data this week, a move that will likely strongly impact equity market sentiment and subsequent discourse from the Federal Reserve. We have previously covered stronger employment data in previous months, while touching on the risks of ongoing layoffs in industries like technology. The previous Jobs Report in May showed strong growth in multiple sectors and raised concerns over the need for rate hikes.1 The current market consensus is that employment growth will be slightly slower in June relative to May.2 These upcoming reports, coupled with new inflation data, should guide the Fed’s assessment of whether it will need to hike interest rates in subsequent quarters. » Stay ahead of your finances: Join our free newsletters today 2. Ceasefire Developments Face New Challenges Recent ceasefire agreements between the United States have helped to support market sentiment in recent weeks. However, geopolitical tensions escalated over the weekend after the market closed, which could have a strong impact on market sentiment this week. Iranian drones recently attacked Bahrain after the United States carried out retaliatory strikes on Iran.3 This development is crucial to monitor, as recent peace developments have supported the market in recent weeks. Any negative developments could harm equity market sentiment in the short term. Energy equities are worth monitoring next week. The Vanguard Energy Index Fund ETF (VDE) has fallen by nearly 10% amid declining geopolitical tensions. However, energy has been a strong-performing sector this year, and is worth monitoring in the short term. » Start investing today: Explore top brokerage accounts with our detailed review 3. Tech Stocks Tech stocks were one of the worst-performing sectors last week. Investors should keep a close eye on tech stocks, particularly semiconductor stocks, as this sector may be very volatile this week. Exchange-traded funds that track the S&P 500 are heavily exposed to tech stocks. The top 10 S&P 500 constituents are all tech and AI companies and account for 37% of the index.4 One key event to watch in markets this week is the Federal Reserve’s additional comments on Wednesday, which could impact technology stocks. These comments will follow the release of labor market data and could provide more insight into the Federal Reserve’s stance on future rate hikes. Tech stocks could be worth monitoring, following their strong sell-off last week, especially since there may be new geopolitical tensions in markets this week. 4. US and International Growth Data One of the main concerns in the market has been a potential slowdown in global growth following tensions in the Strait of Hormuz. Conditions in the United States look a bit more favorable, following recent revisions to Q1 2026 GDP growth data.5 There will be many important pieces of economic growth data released in the markets this week. In the United States, there will be new data released about construction spending, manufacturing PMI, consumer confidence, and other labor market data. The BOJ will also release new inflation and growth data next week, providing more context on the impact of geopolitical tensions. Japan’s quarterly Tankan Business Survey will provide more insight into Japan’s manufacturing activity and economic health. Japan has entered a period of slower growth, with current projections calling for 0.5% growth in FY 2026.6 Recent inflationary pressure has also pushed the BOJ to hike rates to record levels in 2026. The European Union will release new CPI data this week, which should provide more data about the impact of conflicts in the Middle East. Last month’s release showed 3.2% inflation rate in the Euro area, driven by a circa 10% increase in energy prices and lower moves in other categories.7 5. Real Estate and Data Center REITs Real estate stocks performed exceptionally well last week amid the broader sell-off in the S&P 500 and tech stocks. This sector is worth monitoring this week, as there will be new data on construction activity and home prices this week. Another particularly intriguing area to monitor is data center spending, which has risen to record highs in 2026.8 Data center REITs like Digital Realty Trust (DLR) and Equinix ( EQIX) have trounced the S&P 500 this year. Companies like these are worth following as we potentially head into a volatile turn in markets this week.
Are Fidelity ZERO Index Funds Worth It? (The Catch)

What Are Fidelity Zero Funds? What does a 0% expense ratio actually cost you? Nothing, and that’s the whole point. Most index fund investments lose a portion of their gains to fees every year, usually a few hundredths of a percent. The Fidelity Zero lineup drops that to nothing. The four funds (FNILX, FZIPX, FZROX, and FZILX) carry a 0% expense ratio with no minimum investment, and they’re available to retail investors only through a Fidelity account.1 So what do you actually keep? Every dollar these investments earn, minus taxes, will stay in your account and keep compounding. We’ve broken down the rest of these low cost investments in our guide to the best Fidelity index funds to own for life, but the Zero funds are in a tier of their own. A price of zero always has a story behind it though, and these Fidelity funds are no exception. Meet the Four Fidelity Funds Four funds, four slices of the market. Each one tracks a different proprietary Fidelity index, and each holds its own basket of securities. Here’s what you’ll find inside. This is the lineup at a glance, sorted biggest to smallest by assets under management: Fund What it tracks (and resembles) Net assets 5-Yr average annual return Holdings FZROX (ZERO Total Market) The entire U.S. stock market: large, mid, and small cap. Acts like VTSAX or FSKAX. ~$38.6B (largest) 13.12% 2,668 FNILX (ZERO Large Cap) The biggest U.S. companies. A stand-in for the S&P 500. ~$18.6B 13.92% 506 FZILX (ZERO International) Developed and emerging markets outside the U.S. ~$11.6B 9.28% 2,239 FZIPX (ZERO Extended Market) U.S. mid- and small-caps, the market minus the ~500 largest names. ~$2.5B (smallest) 7.68% 2,086 Every fund here charges a 0.00% expense ratio with no minimum. Net assets, holdings counts, and 1-year average annual returns are as of May 31, 2026, per each fund’s Fidelity page. FZROX: The Total Market Index Fund FZROX is the total market index fund of the group. It tracks Fidelity’s proprietary U.S. total-market benchmark and holds roughly 2,700 stocks, thousands of underlying securities across large, mid, and small caps.2 Picture the entire U.S. stock market squeezed into a single ticker, the same job a fund like VTSAX or FSKAX does. It’s also the largest of the four ZERO funds by a wide margin, with about $38.6 billion in net assets as of May 31, 2026, a subtle signal indicating that when investors buy just one, this is usually the one they pick. As of May 2026, the top holdings are a roll call of American business: NVIDIA near 7% of assets, Apple around 6.2%, then Microsoft, Amazon, and Alphabet. One share buys a sliver of nearly the entire U.S. equity market. For plenty of investors, this one total market index fund is the whole stock sleeve of their portfolio. Its total assets keep climbing as money flows in. The fund pays dividends once a year, and the investments inside it change only when the index does. FNILX: The Zero Large Cap Index Fund FNILX is the large cap index fund, the closest thing here to an S&P 500 substitute. It tracks the Fidelity U.S. Large Cap Index, a proprietary benchmark of the biggest U.S. companies, much like the S&P 500 without licensing that name. On size, it is second only to FZROX, holding roughly $18.6 billion in assets, the most popular ZERO fund after the total-market pick. This large cap index fund holds the same mega-cap securities that dominate FZROX, minus the mid and small caps. Want broad blue-chip exposure at a true zero cost? The Zero Large Cap Index Fund (FNILX) delivers exactly that. For a side-by-side with the usual names, see our roundup of the best S&P 500 index funds. Plenty of investors park their core equity investments in this large cap index fund and never look back. FZILX: The International Index Fund FZILX is the international index fund of the lineup, holding securities from developed and emerging markets outside the US. Treat it as a one-ticker way to own the rest of the world’s stock market, from Europe and Japan through to emerging names across Asia and Latin America. By assets it’s the third-largest of the four at about $11.6 billion, the biggest ZERO fund that invests beyond U.S. borders. Add it to the two domestic funds and you’ve got global coverage for a grand total of zero in fund costs. International returns have trailed U.S. stocks for years, but spreading your assets worldwide cuts single-country risk. Want the full case for owning foreign equities? Here’s our take on the best international funds for global exposure. This international index fund is the simplest way to get that exposure inside Fidelity. FZIPX: The Extended Market Index Fund FZIPX is the extended market index fund, covering the part FNILX skips: the mid- and small-cap companies outside the largest names. Pair it with FNILX and you rebuild something close to FZROX’s total-market exposure across two funds. The extended market index fund tracks the Fidelity U.S. Extended Investable Market Index, the smaller and faster-moving slice of the market. That’s where tomorrow’s large caps hide today, and where these investments add a little growth. It’s also the smallest of the four by assets, around $2.5 billion, which fits its job: most investors bolt FZIPX on for completeness rather than build a portfolio around it. How a Zero Expense Ratio Index Fund Works A zero expense ratio index fund sounds like a typo. How does any firm run one for free? Fidelity isn’t doing charity here. It’s running a loss leader, plain and simple. Here’s the mechanism. A traditional fund passes its operating expenses to you through an expense ratio: the management fees, the record-keeping expenses, the licensing. Fidelity eats those expenses on the Zero funds instead. The net expense ratio ends up at 0.00% because Fidelity built its own proprietary indexes rather than licensing the S&P or CRSP benchmarks, which erases the biggest cost and slashes what you’d normally
Markets This Week: 5 Things to Watch (June 22-26, 2026)

Some of the main events in markets this week will be ongoing dialogues between the United States and Iran, as well as new economic data releases following the Federal Reserve’s decision to hold rates steady. This week will be very eventful, as new data will be released that impacts sectors such as technology, real estate, consumer staples, and manufacturing. 1. AI Sentiment Improvements AI-themed stocks could be poised for an additional rally, especially since the Federal Reserve decided not to rates during its recent meeting. The Roundhill Memory ETF (DRAM) has rallied strongly, especially following the short-term political de-escalations. This ETF rose by nearly 10% last Friday, and may continue to have strong momentum and interest from investors this week. This ETF has been one of the fastest-growing ETFs in the market, recently surpassing the $10 billion mark. According to a recent article from Forbes, artificial intelligence stocks will account for around half of the S&P 500’s earnings growth during the year.1 Investors should keep a close watch on stocks with AI exposure, as this rally contains great volatility and no one knows what the upcoming future holds. » Stay ahead of your finances: Join our free newsletters today 2. Energy Stocks and Inflation Sentiment Oil prices have been extremely volatile during recent trading sessions. While potential peace talks have caused crude oil to drop below $80/barrel, oil prices have begun to rebound slightly as Israel’s recent strikes on Lebanon have raised questions over the success of new peace negotiations.2 The Vanguard Energy ETF (VDE) fell by 3% last week, but may be poised to rebound this week if oil prices recover.3 Investors should keep a close eye on energy markets this week, as these stocks may be poised to rebound amid any geopolitical shocks. 3. New Growth Data: Personal Income and Manufacturing Data Tensions in the Middle East have also sparked concerns over potential rate hikes and slower growth in global economies in 2026. Real GDP growth was 1.6% last quarter, but there are many vulnerable areas, such as consumer spending and manufacturing growth, that could cause weaker growth in Q2 2026.4 The BEA will release new information this week, including industry and state data from the quarter, as well as personal income and outlays data for May. Moreover, the upcoming S&P Global Flash Manufacturing PMI data should provide more insight about US manufacturing activity. This data should shed more light on the US economy’s performance during H1 2026 and sentiment for the broader equity markets this week. 4. Consumer Confidence and Real Estate Data US consumers have faced a rocky 2026 since geopolitical tensions began in late February. The combination of a new wave of inflation and potential rate hikes has created more cautious spending habits and delays in real estate transactions. While consumers have experienced temporary relief from the decline in gasoline prices, potential geopolitical shocks could reintroduce inflationary concerns.5 There may be some unique buying opportunities in markets this week for consumer staples or consumer discretionary stocks. ETFs like the Vanguard Consumer Staples Index ETF (VDC) or the Vanguard Consumer Discretionary Index ETF (VCR) may sell off this week on the back of any negative economic news. The US Census Bureau will also release data about new housing sales for May. April data was weak, and any further concerning slump in sales could cause real estate equities to sell off this week.6 5. Gold Amid Peace Negotiations Gold mining equities will likely have an eventful week following their strong decline in the previous week. One potential catalyst to monitor includes any derailing of peace negotiations between the United States and Iran. Iran recently accused the United States of violating its ceasefire agreement, a move that will likely shake markets this week.7 Any additional tensions could cause broader sell-offs in the market, including gold mining stocks. However, gold still retains its appeal in the current economic and geopolitical environment. Investors should keep an eye on any potential derailment of peace negotiations, as well as additional Central Bank buying activity, as this could add to gold’s appeal in the long term. » Start investing today: Explore top brokerage accounts with our detailed review
This AI ETF Hit $10 Billion Faster Than Any ETF Ever (DRAM)

What Is the DRAM ETF? A fund that launched in April 2026 has already pulled in more money, faster, than any ETF in history. That fund is the DRAM ETF, and its story is centered around the chips that make AI run. So what is it? The DRAM ETF is the Roundhill Memory ETF, the first U.S.-listed ETF offering targeted exposure to global memory companies at the center of AI infrastructure demand.1 Roundhill built it as a pure play on the chips that store and move data. Most funds spread your investments across a broad market, this one zeroes in on a single corner of the chip industry. DRAM is an actively managed fund with quarterly rebalancing, and funds like it generally seek exposure to firms that earn most of their revenue from memory products. It currently holds 9 companies, so every name carries weight. For anyone investing in the AI space, the speed here is the story. Investors who watched the largest ETFs by AUM build up over decades do a double take. DRAM charges a 0.65% gross expense ratio and has just past $20 billion in total assets since launch.2 Its performance since the debut has been nothing short of remarkable. These are aggressive investments, poured in by the billion, and you’ll want to balance these holdings against your other investments. Inside the Roundhill Memory ETF The structure of the Roundhill Memory ETF is where it gets interesting. Under normal circumstances, the fund will invest primarily in equity securities of memory companies, or in swap agreements and forward contracts that provide exposure to those same firms. Filings say it puts at least 80% of net assets, plus borrowings for investment purposes, into securities of memory companies or instruments tied to them.3 The issuer counts a firm as a memory company when at least half its revenues or profits come from memory products. Here’s the catch. Many big makers trade overseas, so buying their common stocks directly is hard for a U.S. brokerage. To get around that, the issuer uses derivative instruments, mainly total return swaps, which are contracts with a bank that track a stock’s return rather than holding the share. Each weight is calculated by combining the direct stock with any swap, and the underlying securities can be tricky to value abroad. That setup keeps the fund inside the rules that let it qualify as a regulated investment company for tax purposes. Beyond stocks, the fund can hold preferred securities and a little debt securities, which sit between stocks and bonds. A government money market position, around 15% of assets, holds cash and short Treasuries as collateral behind the swaps. Its operating expenses run 0.65% a year, and those expenses come straight out of returns. The distribution arrives once annually, and that distribution is tiny because the 30-day SEC yield stays low. These are growth investments, not income payers, so the yield barely registers. The investment objectives center around memory. Active management means quarterly rebalancing, so the lineup is subject to change. You can pull the summary prospectus and other information from the fund’s website, an actively managed ETF at its core. Why Memory Powers AI Why has so much money rushed into one fund? The answer is found inside every AI data center. Large models chew through enormous amounts of data, and that data has to move fast from storage to the processor and back. The memory chips that shuttle it have become the choke point of the buildout. Roundhill’s pitch, paraphrased from its launch materials, is that investors had underrated this slice of AI infrastructure and that owning it is the opportunity. Model training is only part of the demand. Cloud platforms and the broader storage stack run on the same memory, which keeps AI hardware money flowing toward the category. How High Bandwidth Memory Feeds AI Chips High bandwidth memory, or HBM, is a stacked, ultra-fast chip that sits next to an AI processor and feeds it data fast enough to keep it working. Without enough HBM, even the strongest chip stalls. That’s the bottleneck. Demand from the AI sector has outrun what memory companies can produce, and their stocks have run hot. A limited number of manufacturers can build HBM at scale, because the technology takes years of research and heavy capital. Want a good look at the wider chip space? Our roundup of semiconductor ETFs covers it. Where DRAM and NAND Fit DRAM, short for dynamic random-access memory, is the working memory a computer uses moment to moment. NAND flash is storage, where data sits when idle. The DRAM ETF covers both, plus solid-state drives. Micron Technology is one of the few U.S. firms here, and investing in it bets that memory companies keep pricing power. The fund’s performance rides on demand, and the data on AI spending says it stays strong. That’s where your investments sit. DRAM ETF Top Holdings The DRAM ETF top holdings pack most of the fund into a few names. Roundhill reports each company’s weight by combining its directly held shares with its total return swap positions, and on that basis Micron Technology is the largest at roughly 29%. SK Hynix sits close behind near 25%, with Samsung Electronics around 18%. Add those up and three companies account for about 71% of the portfolio. Below the leaders the weights thin out fast: Kioxia near 8%, SanDisk close to 6%, Seagate and Western Digital around 4% apiece, then Nanya and Winbond rounding out the memory names. Micron is the one to look at twice. It appears three times in the holdings, once as common stock and twice through swaps, which is how it ends up as the single biggest position. There’s also a sizable cash piece: roughly 15% of assets sits in a government money market fund that backs the swap exposure rather than tracking memory chips directly. Step back from the tickers and the fund’s geographic split is close to even at the top. By region, memory exposure
Markets This Week: 5 Things to Watch (June 15-19, 2026)

Markets are poised for an eventful week, most notably because the Federal Reserve will make a key decision about interest rates based on new inflation and labor market data. Sector divergence will also likely be strong this week, as there will be new developments that impact the real estate, technology, retail, and manufacturing sectors this week. This article will cover recent economic developments and address some of the potential top market movers this week. 1. Upcoming Federal Reserve Meeting The Federal Reserve will meet on June the 16th-17th to make a crucial decision about interest rates as inflationary risks heat up in the market. Inflation recently rose to a new high in May 2026, and there is a strong chance that the Federal Reserve may need to hike rates to bring inflation closer to its long-term target. Other Central Banks, such as the ECB, recently decided to hike rates due to recent inflationary pressure.1 There is a strong chance the Federal Reserve will hike interest rates, especially since inflation recently reached a 3-year high.2 US Inflation Rate A rate hike decision by the Federal Reserve would be negative for equity markets and could hit tech stocks the hardest. This decision, coupled with further developments in the energy sector this week, will strongly impact equity market sentiment. » Stay ahead of your finances: Join our free newsletters today 2. US Retail Sales Data The US Census Bureau will release US retail sales data from May on June 17th. This is an important trend to monitor, as it could impact key retail giants like Walmart, Nike, and other major retail companies. Last month’s data was relatively strong, showing 4.9% YoY growth and 0.5% MoM growth, but any disappointing data could be negative for the equity markets.3 Retail ETFs, such as the State Street PDR S&P Retail ETF (XRT), have had relatively flat YTD performance amid concerns of lingering inflation and slower economic growth. Additional rate hikes and sticky inflation could dampen retail sentiment and cause these stocks to correct in the short term. 3. Middle East Tensions and Manufacturing Outlook Manufacturing companies may face new headwinds in the upcoming months, as ongoing tensions in the Middle East have led to rising raw materials costs. According to a recent survey from Industrial Info, 83% of manufacturers cited rising raw materials prices due to conflicts in the Middle East as their primary concern.4 Overall, US manufacturing data has been strong in the first few months following tensions between the United States and Iran. The S&P Global US Manufacturing PMI recently hit 55.1 last month, representing a multi-year high.5 However, data may become much weaker in subsequent months. Investors should monitor continued negotiations between the United States and Iran next week, as this will have a strong impact on sentiment for US manufacturing stocks. 4. Technology Stocks Trends Sentiment for technology stocks has been cooling down, as seen by the strong underperformance of tech stocks relative to the broader market last week. Technology stocks will likely face another challenging week, as the Federal Reserve will make a key decision about interest rates. Tech stocks have recently been very sensitive to concerns that the strong Jobs report and rising inflation will lead to an interest rate hike.6 Accenture will also release earnings data next week, which should provide more clarity about the sentiment for US tech stocks. The market is currently expecting strong earnings for this stock, which has struggled with a circa 36% YTD decline.7 Any disappointing earnings results from Accenture and other tech companies could cause investors to flee to other less risky sectors, such as utilities or telecommunications stocks. 5. US Real Estate Investors should also keep an eye on developments in the US real estate industry, following the slight uptick in home sales in May.8 There are several pieces of data that investors should monitor, as real estate stocks are poised to have an eventful week. The US Census Bureau will release data about new housing starts and building permits on the 16th of June. This will provide additional data about whether we are heading for a cooldown in the real estate industry. Moreover, the Fed’s decision regarding interest rates will strongly impact real estate stocks, as higher rates would put more pressure on new homebuyers. House-related spending currently accounts for 15-18% of total household spending in the United States, so any negative developments in this sector could spill over to other consumer-related sectors.9 » Start investing today: Explore top brokerage accounts with our detailed review
High-Yield Savings Account vs Brokerage Account

Where Should Your Money Go? So you have some cash set aside, and you’re weighing a high yield savings account vs brokerage account. Which one should hold it? Start with the question behind the question. Where should your money go right now? Most people juggle four goals at once. An emergency fund for worst case scenarios. Short term savings for a near purchase. Money to invest for long-term goals. Where to hold cash while you wait to invest it. Each goal carries its own timeline, and the timeline ultimately should decide the right account. Matching the Account to Your Goal Here’s the test. Need the cash within a few years? Liquidity wins, so keep your money safe and easy to access. Planning to invest for a decade or more? You can take on market risk for higher growth. A down payment due next spring belongs in short term savings. Retirement savings you won’t touch for 30 years can ride the market. The key differences between these accounts come down to the big question: when will you need the cash? Answer that, and your plan almost writes itself. That’s the core of good personal finance. What Is a High Yield Savings Account? A high yield savings account is a savings account that pays much more interest than a standard one. You’ll find the best rates at online banks and credit unions, which skip the cost of branches and pass the savings on to you as higher yields. Open one, move your cash in, and it starts working right away. Want to see what that looks like in dollars? How a High Yield Savings Account Works to Earn Interest The difference in actual dollars is bigger than most people expect. The national average savings account rate sat at just 0.38% APY in May 2026, while a strong high yield savings account paid roughly 4% to 5%.1 Park $10,000 at that 0.38% base rate and you earn about $38 over a year. Move it to a high yield savings account near 4%, and the interest earned jumps to roughly $400. Same cash, ten times the yields and the interest earnings. Banks set a base rate that tracks broader interest rates, so what you earn can change over time. A few tenths of a percent on the APY still add up, so compare the highest APY accounts. FDIC Insurance and Monthly Limits Safety is the other half of the appeal. A high yield savings account at an FDIC insured bank protects your deposit up to $250,000, so even if the bank stumbles your savings stay covered. FDIC insurance kicks in automatically at member banks and credit unions. There’s a tradeoff. These are interest bearing accounts built for saving, so some set a monthly limit, capping withdrawals at a certain number each cycle, and a transfer can sometimes take a couple of business days to clear. Your HYSA interest also counts as taxable income, so expect a tax form once you cross $10 in interest earned for the year. Want the competitive rates without the friction? Compare a few accounts first. Many traditional savings accounts can’t offer higher rates, because those traditional savings accounts pay for branches and tellers, which keeps yields low. What Is a Brokerage Account? A brokerage account is an account you use to buy and sell investments like stocks, bonds, ETFs, or whatever else fits your plan. Before you invest, you fund it with a deposit, then you invest in the stock market whenever you want. It does more than hold stocks, though. Many of these accounts double as a place to keep cash, write checks, and spend with a card. Account Features That Set Brokerage Accounts Apart The account features go well beyond trading. Most brokerage firms now offer check writing, debit cards, and bill pay, which blurs the line between investment accounts and a bank account. You can hold Treasury holdings, money market funds, and individual bonds alongside your stocks. Some investors even run a robo advisor inside the account to automate their transactions. Transfers usually settle within a couple of business days. These are also the accounts behind most retirement accounts, so the same features carry over to your long term investment. How Brokerage Cash Can Earn Interest Here’s the part people sometimes miss. The uninvested cash in a brokerage account doesn’t have to sit there dormant. Most brokers sweep it into a program that pays interest. Cash management options often pay yields close to a strong high yield savings account. Charles Schwab, for one, sweeps uninvested cash to a network of partner banks. A brokerage bank-sweep program spreads your cash across multiple FDIC member banks, which can push total FDIC coverage above the $250,000 single-bank limit.2 So that cash earns a return while you decide where to invest next. Each deposit clears fast, and you can move cash between investments without a separate bank transfer. High-Yield Savings Account vs Brokerage Account How the two accounts compare. Figures as of mid-2026. Feature High-Yield Savings Account Brokerage Account Best for Money you may need within a few years, such as an emergency fund or short term savings Money you can leave invested for the long term, such as retirement or building wealth What you can hold Cash deposits only Stocks, bonds, ETFs, money market funds, brokered CDs, and Treasuries Typical return National average 0.38% APY; top accounts roughly 4% to 5% APY Varies with the market; the S&P 500 has averaged about 10% a year since 1957 Earns interest on cash Yes, on the full balance Yes, on uninvested cash through money market sweeps Insurance FDIC insured up to $250,000 per bank SIPC up to $500,000 per customer (including $250,000 for cash); bank sweeps can extend FDIC across multiple banks Risk of losing money Very low; your principal is protected Yes; investments can fall in value, and no insurance covers market losses Liquidity High; cash is available quickly High for cash; selling some holdings can take a day or
Markets This Week: 5 Things to Watch (June 8-12, 2026)

The S&P 500 fell by around 2.5% this week, mainly due to the strong market sell-off on Friday. The combination of inflationary pressures and an uptick in new jobs led many investors to worry about rate hikes in the coming quarters. Tech stocks were hit the hardest, while there were several positive market movers this week. Here are some of the recent major economic developments, as well as the top market movers this week. 1. Tech Stocks Sell Off Friday was a challenging day for the market, as the S&P 500 fell by nearly 3% during the trading day. The market is strongly concerned about potential rate hikes following the new labor market data, which resulted in strong selling pressure for technology stocks. The Nasdaq, which has an even heavier tech weighting, fell by 4% on Friday.1 The Vanguard Information Technology ETF (VGT) fell by over 6% on Friday, erasing some of its stellar YTD gains. Major tech themes like quantum computing also sold off strongly on Friday, with many industry leaders falling by over 11%.2 Tech stocks have been the main driver of recent market performance, but may be very vulnerable to short-term pullbacks amid new economic risks in the market. » Stay ahead of your finances: Join our free newsletters today 2. New Jobs Report Increases Rate Hike Risks Markets responded poorly to the newly released Jobs report, which showed that the labor market is much stronger than expected. This new data, coupled with rising inflation in recent months, signals that the Federal Reserve may have to hike interest rates. The US economy created over 150,000 jobs in May, while the unemployment rate remained steady at 4.3%.3 This report surprised the market, as it is the third consecutive positive report amid the new rise in inflation in the markets. All eyes will be on the Federal Reserve as it processes this new information, as well as subsequent inflation readings. 3. New Inflation Concerns One of the main events in markets next week will be the release of new inflation data on June 10th. Oil prices remained above $90/barrel for most of May, and other indicators like services inflation have also been rising near a twelve-month high.4 Friday’s exaggerated sell-off shows that the market is currently very sensitive to any news surrounding potential rate hikes, so markets could sell off strongly again due to any poor inflation readings. Sentiment is mixed, but many economists are calling for higher inflation, especially if tensions in the Middle East continue. According to the Survey of Professional Forecasters, inflation may hit 6% this quarter.5 Investors should keep an eye on the upcoming CPI data this week. Hotter inflation could cause further market corrections if higher readings further exacerbate fears of a potential rate hike. 4. Top Performing Sectors While themes like information technology and consumer discretionary stocks were slammed on Friday, some themes managed to hold their ground amid the broader market sell-off. Some of the best-performing sectors on Friday included consumer staples, utilities, real estate, healthcare, and financials stocks.6 This trend highlights how themes with higher valuations, like consumer discretionary and IT stocks, were more sensitive amid the new fear of rate hikes. Other alternative investments, like bitcoin, also experienced a strong sell-off on Friday. The price of bitcoin fell by nearly 20% during the trading week, its largest weekly decline since the collapse of FTX in late 2022.7 5. Gold’s Rising Relevance Gold has been one of the best-performing commodities in recent quarters. One of the main developments supporting gold has been increased buying from Central Banks. Gold recently surpassed treasuries to become the top global reserve asset, according to an ECB report.8 This is very positive news for gold, which has become a strong safe haven for Central Banks, institutional investors, and retail investors alike. » Start investing today: Explore top brokerage accounts with our detailed review
Brokerage Account vs IRA: What’s the Difference?

Two Types of Investment Accounts Most people saving use one of two main investment accounts, and plenty assume they should pick just one. You don’t. A brokerage account and an IRA do different jobs, so your choice depends on your financial goals and your timeline. A brokerage account is built for flexible investing at any age. An IRA, short for individual retirement account, carries tax advantages a brokerage account doesn’t have. IRAs are retirement accounts in the tax code. Taxable brokerage accounts are not. Both are investment accounts, both can hold the same investment funds and stocks, and both can grow your money for decades. They’re two tools in one drawer. One gives you freedom, the other tax advantages for following a few rules. What Is a Brokerage Account? A brokerage account is an investment account you open at a registered brokerage firm to buy and sell stocks, bonds, mutual funds and ETFs.1 Those exchange traded funds (ETFs) and other securities trade right through it. There’s no annual cap on what you add. Your money stays liquid, so you can sell and withdraw anytime. All investing involves risk, since values rise and fall. If you’d like to compare providers, see our list of best brokerage accounts. How an Individual Brokerage Account Works An individual brokerage account is the standard setup, owned by one person. You fund the individual brokerage account from your bank, pick from stocks, bonds, mutual funds and more, and place trades yourself. It’s self directed, so no advisor signs off. You can open an individual brokerage account online in minutes at almost any financial institution, often with no initial investment minimum. Once the cash settles, the individual brokerage account is yours to invest. Want to share ownership? A joint individual brokerage account works the same, two names instead of one. Taxes on a Taxable Brokerage Account Here’s the catch with taxable brokerage accounts: the IRS wants a cut along the way. Sell a stock for a $1,000 gain and that profit can be taxed the year you sell. Dividends and interest income get taxed too. Say you book $1,000 in investment earnings inside a taxable investment account. Depending on your bracket, you might pay taxes of a couple hundred dollars. A brokerage account is fully taxable. Taxable brokerage accounts give no shelter, so plan for the bill accordingly. That yearly drag is the price of the flexibility taxable brokerage accounts offer. What Is an Individual Retirement Account? An individual retirement account, or IRA, is built for retirement savings and comes with real tax benefits, and many traditional contributions are tax deductible. You can put in up to $7,500 a year for 2026. A brokerage account has no such cap. An individual retirement account comes in two types, a traditional IRA and a Roth IRA, taxed in opposite ways. Both are retirement accounts and tax advantaged accounts. The tax benefits are the whole point. Your money grows deferred or tax free, depending on which you pick. Traditional IRA vs Roth IRA The difference between these two account types is about when you get the tax break. A traditional IRA often gives a tax deduction the year you contribute, so traditional IRA contributions can lower your taxable income now, and you pay income tax later, at withdrawal. A Roth IRA flips that. You fund a Roth IRA account with after tax dollars and claim no deduction today, so it grows deferred or tax free. Tax deductible contributions cut your bill now, while a Roth keeps its tax deductible perk for retirement instead. Younger savers often lean Roth. Want the retirement side first? Here’s our breakdown of Roth IRA vs Traditional IRA. How Tax Deferred Growth Works Inside a traditional IRA, your investments compound with no yearly tax bill, fully tax deferred. That’s tax deferred growth. You don’t report dividends or capital gains each year, so nothing leaks to taxes while you work. Letting the account grow tax deferred for two or three decades can mean tens of thousands more at retirement, because every dollar that would have gone to the IRS stays invested and compounds. The tax comes due only at withdrawal time. You can read more about the top investments to keep in an IRA to maximize your investment opportunities. Tax-Free Withdrawals From a Roth IRA The Roth IRA payoff lands in retirement. You already paid the tax going in, so your money grows tax free and qualified withdrawals come out completely tax free after 59½. Money in a Roth account just keeps building. That tax free growth is why a Roth IRA is so popular with younger investors. Tax free withdrawals also keep reported retirement income lower, and tax free growth rewards waiting. Once you reach retirement, the investments you hold can become just as important as the account itself. Here are some of the best ETFs to hold in an IRA during retirement. IRA Contribution Limits for 2026 For 2026, the total across all your IRAs is $7,500, or $8,600 if you’re 50 or older.2 Those IRA contribution limits cover a traditional IRA and a Roth IRA combined, not each separately. The annual contribution limits set by the IRS tend to rise every few years. Split your Roth IRA contributions and traditional dollars however you like under the cap. You can contribute to a Roth or a traditional account, your call. For the income side, see our guide to Roth IRA contribution limits. These contribution limits usually reset each January. Roth IRA Income Limits for 2026 A Roth IRA also has income limits. For 2026, you can make a full contribution if your income is under $153,000 single or $242,000 married filing jointly. Earn more and the amount you can contribute to a Roth phases down, then stops. A traditional IRA has no income ceiling to contribute, though a workplace retirement plan can limit your tax deduction. These income limits change every year, so check first so you can plan based on those limits. Brokerage
Markets This Week: 5 Things to Watch (June 1-5, 2026)

The U.S. economy is beginning to deliver new warning signs, including a cooldown in real estate and consumer sentiment as inflation risks rise. However, performance was strong this week as tech stocks helped to support the S&P 500. New peace talks between the United States and Iran also supported the market this week. Below are five major developments in the markets this week, as well as some of the top market movers this week. 1. Oil Price Decline Amid Inflationary Concerns The price of oil continued its descent during the week, driven by new peace talks between the United States and Iran. The price of crude oil fell to $88/barrel on Friday, marking an 18% monthly decline.1 Oil equities have pulled back strongly on this news, following their strong YTD rally. The VanEck Oil Services ETF fell by 6.3% during the trading week, while the State Street Select Sector SPDR Energy ETF declined by 5%. At the moment, a rebound in inflation appears to be one of the highest risks in the market, one that will put pressure on the Federal Reserve’s interest rate policy. The Fed needs to see lower inflation levels before it can consider moving forward with rate cuts. » Stay ahead of your finances: Join our free newsletters today 2. US Economic Growth Recovers Slightly in Q1 2026 After delivering weaker growth in Q4 2025, the US economy has rebounded slightly this quarter. This news is positive, as concerns have been growing about slower growth amid geopolitical tensions and higher energy prices. Q1 2026 economic growth was 1.6%, compared to 0.5% in the previous quarter.2 One positive sign in the economy has been the growth in manufacturing activity during the first quarter of this year.3 However, supply-side risks coupled with weaker consumption as inflation picks up could result in lower growth in subsequent quarters. Other regions, such as the EU, have also been cutting their growth forecasts for this year. 3. Consumer Confidence at a New Low The geopolitical shocks in the Middle East have begun to put new stress on consumers, especially since inflation has risen in many regions since the end of February this year. The University of Michigan’s Consumer Confidence Index recently plunged to a 1-year low.4 This tension has been evident in the performance of consumer stocks. We previously touched on how even safer consumer staples giants like Walmart have been facing pullbacks amid weaker 2026 guidance. The Vanguard Consumer Staples Index Fund ETF fell by around 2% this week due to the hazy consumer staples sector outlook. 4. Real Estate Slowdown The U.S. real estate industry is beginning to experience signs of a slowdown this year, as higher financing costs and lower economic optimism have caused housing sales to decline. Recent monthly data from the industry shows that home sales in the United States fell by 6.2% last month.5 Real estate equities have been very sensitive to this stagnating trend. The iShares U.S. Real Estate ETF (IYR) fell by over 2% this week and has had flat performance this month following its mild Q1 rally. This trend is certainly worth monitoring in the coming months, as RE equities and even high-yielding REITs may fall out of favor due to weaker sentiment in the real estate industry. 5. Tech Stock Rally Although many sectors declined during the trading week, tech stocks were the strongest market movers this week. The iShares U.S. Technology ETF (IYW) rallied by more than 3% this week, providing massive support to the S&P 500 as other sectors lagged. Tech giants like Microsoft rallied strongly during the week, and other older dot-com darling stocks like Dell, Cisco, and Nokia have been booming amid new AI optimism.6 Tech stocks are a key driver of the S&P 500, as they have rallied 26% this year and currently account for around 35% of the S&P 500.7 However, it is still important to keep an eye on valuations and monitor the risk of any future pullbacks this year. » Start investing today: Explore top brokerage accounts with our detailed review
10 ETF Portfolios Backtested: The Results Might Surprise You

What We Tested and Why Portfolio Structure Matters If you had put $100,000 into any of these portfolios back in January 2016, the gap between the best outcome and the worst is an eye-opening $300,000. That’s what portfolio structure can cost or earn you over time. With so many ETFs available today, most people never get a direct side-by-side comparison backed by real data. That’s what we are putting in front of you today. We ran 10 model portfolios through 10 years of proprietary analysis (January 2016 to December 2025) on a $100,000 starting balance. These are the ETF portfolio structures investors debate most online, in books, and across investing communities, each built around different investment objectives, risk profiles, and underlying philosophies. Exchange-traded funds trade throughout the day on national stock exchanges at market prices, which makes them far more flexible than mutual funds for building and adjusting a diversified ETF portfolio.1 For a full comparison of how those structures differ, the ETFs vs. mutual funds article walks through the key differences. Each ETF portfolio below is built from individual securities, uses a unique investment strategy, and can be copied on most platforms. The net asset value of an ETF reflects its underlying holdings, but they trade at their market price throughout the day. The allocation model changes across each setup, and the results are more varied than most expect. If you’re new to exchange-traded funds, check out our guide on How to Invest in ETFs: Step-by-Step for Beginners before building your own portfolio. The 4 Stats That Actually Matter for Any Asset Allocation Decision So what numbers should you actually care about? For this test: 10-year CAGR, end balance on $100,000, standard deviation, and maximum drawdown. The CAGR gives you the annualized return over the full period. The end balance makes percentages tangible. Standard deviation measures year-to-year volatility, how much the annual returns bounced around to produce that CAGR. Lower standard deviation means a smoother ride, while higher means bigger swings in both directions. Max drawdown is the worst peak-to-trough loss during the period, which is tied to risk tolerance, because it tells you whether you could have held through the tough times. These four cover return, scale, volatility, and risk in one run. The Benchmark: Why VT Was Used as the Baseline Instead of the S&P 500, VT (Vanguard Total World Stock ETF) serves as the benchmark for this test. It represents the broadest possible equity exposure in a single fund, covering U.S., developed international, and emerging markets all at once. That makes it the most honest baseline for comparing portfolios with different geographic tilts. Every portfolio below is measured against it. Over the 10-year test period, VT posted an 11.77% CAGR, growing $100,000 to $304,201 with a -25.52% max drawdown and a standard deviation of 14.68%. Just so you know, the S&P 500 (via VOO) returned a 14.79% CAGR over the same period.2 The investment strategies that worked in this window all had a significant U.S. stock market focus, specifically on large-cap growth positions, and kept fixed income light despite climbing interest rates. » Stay ahead of your finances: Join our free newsletters today ETF Portfolio Examples: All 10 Tested Side by Side Here’s how all 10 ETF portfolio examples did from January 2016 through December 2025, starting from $100,000. All results are from proprietary analysis. Mutual funds and actively managed products were excluded. Every position here is a passive index ETF or low-cost fund. VT (Vanguard Total World Stock ETF) is the benchmark. 10 ETF Portfolios Backtested Over 10 Years | January 2016 – December 2025 | $100,000 Starting Balance Portfolio # of ETFs 10-Yr CAGR End Balance ($100K Start) Std Dev Max Drawdown VT — Benchmark 1 11.77% $304,201 14.68% -25.52% Warren Buffett (2-Fund) 2 13.57% $356,866 13.56% -21.98% DS Taxable Growth (2-Fund) 2 16.62% $465,175 16.17% -27.75% Bogleheads (3-Fund) 3 10.79% $278,688 12.42% -23.12% YouTubers (3-Fund) 3 15.63% $427,376 15.04% -24.03% Paul Merriman (4-Fund) 4 11.87% $306,877 16.68% -27.42% Ray Dalio All Weather (5-Fund) 5 6.61% $189,595 8.55% -20.68% David Swensen (6-Fund) 6 7.95% $214,930 10.88% -22.31% Coffeehouse (7-Fund) 7 7.07% $197,996 10.52% -19.70% DS Ultimate (9-Fund) 9 17.36% $495,844 15.65% -26.60% Notes: All results from proprietary Portfolio Visualizer analysis (Jan 2016–Dec 2025). VBR used as small-cap value proxy for Paul Merriman backtest; AVUV recommended going forward. FBTC excluded from DS Ultimate historical data due to BTC early momentum being an outlier. 1. Total World 1-Fund ETF Portfolio (VT): The Benchmark One ETF and done. The world’s simplest portfolio strategy is the Vanguard Total World Stock ETF (VT). It holds close to 10,000 stocks across global markets that consist of the U.S., developed international, and emerging markets. It’s also the benchmark for this entire test, chosen because it gives you the broadest possible equity exposure out there, that you can get with one convenient purchase. If your portfolio can’t beat it, a single 0.06% ETF would have done the job. The results after 10 years: VT returned 11.77% a year, ending up with a balance of $304,201, with a standard deviation of 14.68%, that’s volatile, and a max drawdown of -25.52%, a significant fall. And VT trailed the S&P 500 by around 3 percentage points a year, mostly because international stocks didn’t do nearly as well. The expense ratio is 0.06%, which is low for one ETF covering the entire global market. If you want broad market exposure and zero maintenance then you can’t get much simpler than this. 2. Warren Buffett 2-Fund Portfolio Buffett recommends something here that actually makes a lot of sense; put 90% of your portfolio funds into a low-cost S&P 500 ETF and 10% into a short-term government bond ETF. You can take his word for a lot, he has credibility. His track record at Berkshire Hathaway spans decades and has made him one of the wealthiest people alive. The results after 10 years: a 13.57% yearly return, with an ending balance of $356,866, standard deviation of 13.56%
How To Invest In Crypto For Beginners (2026)

What Is Cryptocurrency? Bitcoin launched in 2009 as the first cryptocurrency, built on a simple premise: a form of digital money that operates without a central bank, with a decentralized network of computers verifying transactions instead of a bank. The total amount of Bitcoin in circulation is capped at 21 million coins by design, and new Bitcoin enters the market at a decreasing rate. That built-in scarcity works in a similar way to the value of gold, establishing Bitcoin as a store of value and driving the innovation behind all those other digital currencies that followed. These days, cryptocurrency is a recognized asset class with trillions in total value. If you are ready to start investing, doing some research on our best cryptocurrency platforms review is a great place to start. How Blockchain Technology Works Blockchain technology is the underlying technology that makes cryptocurrency possible. A blockchain is a distributed ledger, a record of transactions stored simultaneously across thousands of computers worldwide with no central server holding the data. Each transaction gets grouped into a block. Once verified, that block gets linked to the one before it. Blockchain transactions are extremely difficult to alter because changing any one entry requires changing every block after that across every node, at the same time, which is practically impossible. You don’t need to become a master in blockchain technology to invest in cryptocurrency. The basics are enough for you to understand what you are buying into. How Does Blockchain Work? When you send cryptocurrency, the blockchain technology starts to work right away. The transaction is broadcast to all the nodes on the network, each one of which verifies your ownership of the assets. Once enough nodes have confirmed it, the transaction gets sealed into a new block and is locked in permanently. Blockchain is a much faster and more efficient way of doing things than traditional banking methods. A bank transfer can take days to go through multiple clearing houses, but a crypto transfer settles peer-to-peer in minutes. Blockchain technology also enables decentralized finance (DeFi), which allows financial services like lending and trading to operate without traditional banks using smart contracts. However, most beginners focus on Bitcoin and Ethereum first. Main Types of Crypto Not all cryptocurrency is the same. Here are the four categories that most beginners will come across: Bitcoin (BTC): The original and the biggest by market cap. Primarily thought of as a store of value. New crypto coins tend to follow Bitcoin’s price direction when things get volatile. Altcoins: Cryptocurrencies other than Bitcoin that offer different features like smart contracts or faster transactions. Stablecoins: Cryptocurrency pegged to the US dollar or another stable asset. Used to hold a market position without taking on too much price risk. Exchange Tokens: Coins created by crypto exchanges that give users benefits like lower trading fees and rewards. How Crypto Wallets Work A crypto wallet doesn’t actually hold your cryptocurrency, it holds the private keys that prove you own it and allow you to transfer it. According to the SEC, the actual coins stay on the blockchain, the wallet is just the access point.1 Lose access to your own wallet’s private keys, and there is no recovery. There are basically three custody options to keep your coins safe: custodial wallets managed by a crypto exchange, self-custody hot wallets you control through software, or cold storage hardware wallets that stay offline. Most beginners start with custodial, which is like having a bank account, the security is handled by the platform. How to Buy Crypto To buy crypto, open an account on a platform like Coinbase or Gemini, complete identity verification, and link a bank account or debit card as your payment method. Search for the cryptocurrency you want, put in the amount you want to invest, and confirm. It’s basically that simple. A few things to keep in mind before you make your first trade: the fees on different platforms can vary wildly, and on top of that you need to watch out for other costs like ‘spread charges’ that can really add up if you’re buying in small amounts. Turn on two-factor authentication right away, security is way more important here than it usually is on other financial platforms. Cryptocurrency Trading vs. Crypto Trading Before putting money in, ask yourself: are you planning to actively trade crypto, or are you simply looking for long-term exposure? If you’re thinking of actively trading, that means keeping a close eye on market data every day, reading up on all the latest news, and making trades whenever you see an opportunity, and sometimes using specialized tools like futures contracts to get an edge. The problem is, that kind of trading requires a lot of time and a high tolerance for risk. For most people though, trading crypto just means buying a few coins, holding on, and reviewing every now and then. People who go in without a solid plan tend to do a lot worse than those who are just holding for the long term. If you do want to trade actively though, you will need to be ready to compete with professionals who have real-time market data and are working round the clock. How To Invest in Crypto: Your Crypto Investing Options There are basically three main ways to get into crypto, and which one is best for you will depend on your investment strategy and how much risk you are willing to take on. Buying directly through a crypto exchange is the most straightforward way to start. Set aside an initial amount, even $20 or $50 is enough to get going on most platforms, and buy some fractional coins. Long-term investors who own the coins directly have a lot more control over their investments, and they can also trade at will if the value goes up or down. The catch is that these investments do require some active management to keep them secure. The two options below are for people who want to get some exposure to
Markets This Week: 5 Things to Watch (May 26–29, 2026)

The market ended on an optimistic note this week due to a newly proposed peace agreement between the United States and Iran. However, there are still multiple economic headwinds in the market, including inflation and rate hike risks, which have made investors cautiously optimistic. Some of the top market movers this week included utilities and telecommunications stocks, while major tech giants underperformed. Here are five major developments to keep on your radar. 1. Further Wave of Tech Layoffs AI-driven tech layoffs have remained dominant during the first half of 2026. Meta Platforms recently announced that it plans to eliminate 8,000 employees.1 This is part of a broader trend among many tech companies as they increasingly implement AI. AI-driven job cuts currently account for around 17% of total layoffs in 2026, according to Challenger, Gray & Christmas.2 While April’s Jobs data was encouraging, there are still many weak areas in the labor market.3 Areas like manufacturing and federal employment have experienced strong declines in employees since the beginning of the year. Further layoffs in tech and other traditional industries like manufacturing may result in more unfavorable Job reports in the upcoming months. 2. Weak Consumer Sentiment and Walmart’s New Guidance Consumers are beginning to feel more pressure from tightening economic conditions, and this trend will likely increase as inflation continues to take a toll on the economy. Retail sales growth during the first four months of this year has been encouraging.4 However, some leading retail companies are beginning to lower their guidance amid recent economic and geopolitical tensions. One of the best companies to monitor to track retail sentiment in the United States is Walmart, as demand for its products generally remains more consistent during slower and/or inflationary cycles. However, shares of Walmart fell by 8.7% this week amid its weakened guidance and warnings that it may need to raise prices due to rising fuel prices.5 Even cautious picks like Walmart seem vulnerable as the risks of long-term inflation and stagnation heat up. 3. Positive US-Iran Sentiment Supports End-of-Week Performance The market began to rally during the second half of the week following optimism about peace talks between the United States and Iran. However, Iran has criticized the United States’ excessive demands, and the United States has not finalized any agreement.6 Oil prices fell slightly on this news, and crude oil is currently below $100/barrel. Equity markets performed better on Thursday and Friday due to this news, and could experience pullbacks next week if there are any setbacks with this deal. 4. EU Growth and Inflation Forecast A common risk among global markets is the potential for slower growth and an uptick in inflation. The risk of a stagflationary environment during 2027 is also in the cards. The European Union recently released new economic forecast data, which calls for weaker growth and a new rise in inflation. It is crucial to note that these current projections are still very moderate, as inflation rose much higher in 2022 due to tensions between Russia and Ukraine. H2 2026 could bring much gloomier projections if tensions in the Middle East continue. 5. Utilities Stocks Deliver Stellar Gains Utilities stocks surprised the market this week, significantly outpacing other defensive themes like consumer defensive stocks. According to data from Morningstar, utilities stocks drastically outperformed the broader US market and consumer defensive stocks, too. These stocks outperformed leading tech giants like Meta Platforms, Netflix, Nvidia Corporation, and Microsoft. This signals that the market may be looking for more cautious alternatives as optimism for Mag7 stocks fades. » Start investing today: Explore top brokerage accounts with our detailed review
The Best Budgeting Apps of 2026
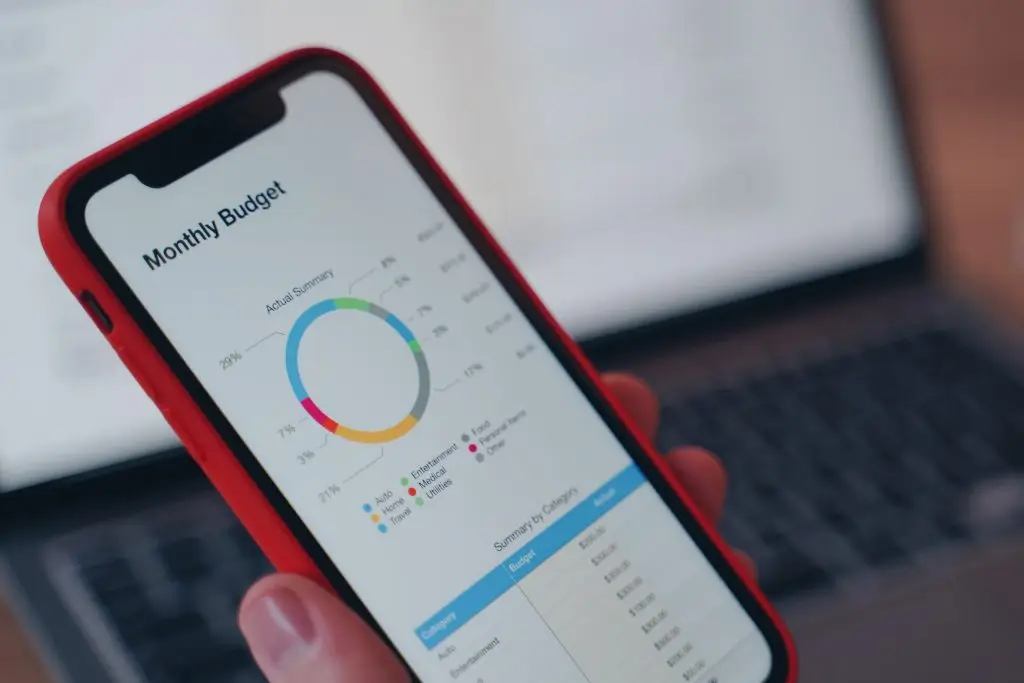
Budgeting apps are a great way to track your spending and organize your bills. They can give you a bird’s-eye view into your daily financial expenditures, and provide a pathway to understanding how to save, invest, and reach your financial goals. Budgeting apps come in all different shapes and sizes as well. Some are simple spending trackers, while others include SaaS monitoring, net worth tracking, and tools for household budgeting. The best budgeting app for you will depend on your personal situation and what features suit you best. Let’s break it all down below. Best Budgeting Apps of 2026 Which Budgeting App Is Best for You? Monarch Money: Best for Full Financial Overview InvestLane Rating: 4.9 /5 OPEN AN ACCOUNT on Monarch Money’s website QUICK FACTS Cost: Up to 50% OFF first year (code MONARCHVIP) $99.99/year or $14.99/month after 7-day free trial Android Rating: 4.8 iOS Rating: 4.9 Our Review Pros: Highly customizable budgeting system with both flex and category-based budgeting. All-in-one dashboard covering net worth, spending, investments, and cash flow. Strong collaboration tools for couples and shared financial planning. Advanced goal setting for savings, debt payoff, and long-term planning. Clean, modern interface with powerful reporting and insights. Cons: No free version after the 7-day trial. Higher subscription cost compared to most budgeting apps. No bill negotiation or cost-cutting automation tools. Our Take: Monarch Money is built for users who want a complete, unified view of their finances rather than just a basic budgeting tool. It stands out for its flexibility, allowing you to fully customize how you track spending, net worth, and financial goals in one dashboard. The collaboration features also make it especially useful for couples or shared financial planning. While the price is on the higher end and there’s no free tier, Monarch delivers one of the most powerful and flexible budgeting experiences available today. Rocket Money: Best for Subscription Tracking InvestLane Rating: 4.8 /5 OPEN AN ACCOUNT on Rocket Money’s website QUICK FACTS Cost: Free version or $7–$14/month after a 7-day free trial Android Rating: 4.6 iOS Rating: 4.5 Our Review Pros: Easily identifies and cancels unwanted subscriptions. Bill negotiation features can help lower monthly expenses. Free credit score monitoring and access to credit reports. Autosave feature to help build savings automatically. Clean interface with strong spending insights and tracking tools. Cons: Free version is limited in features. Charges a 35%–60% fee on savings from successful bill negotiation. Limited investment tracking compared to some competitors. Our Take: Rocket Money is a strong choice for users focused on cutting expenses and optimizing their monthly spending. Its standout subscription tracking and bill negotiation tools make it especially useful for identifying wasted money and lowering recurring costs. While the free version is somewhat limited and negotiation fees can be high, the app delivers solid value for those looking to simplify their finances and save more with minimal effort. Empower: Best for Net Worth Tracking InvestLane Rating: 4.8 /5 OPEN AN ACCOUNT on Empower’s website QUICK FACTS Cost: Free Android Rating: 3.0 iOS Rating: 4.8 Our Review Pros: Free all-in-one dashboard for tracking spending, savings, and investments. Connects bank accounts, credit cards, loans, IRAs, and 401(k)s in one place. Provides a clear net worth and portfolio overview. Basic spending insights with categorized transactions. Available on both mobile and desktop. Cons: Not designed for hands-on budgeting or spending plans. Limited tools for actively assigning or managing monthly budgets. Less useful for users focused on day-to-day money management. Our Take: Empower is best suited for users who want a high-level view of their financial life rather than detailed budgeting control. It excels at bringing everything together including investments, accounts, loans, and net worth into one simple dashboard. While it includes basic spending insights, its real strength is tracking long-term wealth growth, making it ideal for investors and users who prioritize big-picture financial monitoring over granular budgeting. Quicken Simplifi: Best for Everyday Spending InvestLane Rating: 4.6 /5 OPEN AN ACCOUNT on Quicken’s website QUICK FACTS Cost: $2.99/month billed annually, 50% introductory discount included Android Rating: 4.2 iOS Rating: 4.5 Our Review Pros: Comprehensive budgeting tools with customizable spending plans and savings goals. Automatically categorizes transactions and tracks bills and subscriptions. Personalized budget that adjusts based on your income and spending habits. Can be shared with a partner for household budgeting. Includes credit score monitoring and net worth tracking. Cons: No free plan or trial (only a 30-day money-back guarantee). No built-in bill pay feature. Our Take: Quicken Simplifi stands out as one of the best budgeting apps for handling everyday finances, especially for couples or families. Its personalized spending plan, strong automation, and clean interface make it easy to stay on top of bills, track goals, and understand where your money is going. While the lack of a free version may be a drawback, the overall feature set and usability make it a strong value for those serious about budgeting. Origin: Best for AI Wealth Management InvestLane Rating: 4.5 /5 OPEN AN ACCOUNT on Origin’s website QUICK FACTS Cost: 7-day free trial $12.99/month or $99/year after trial unless canceled Android Rating: 4.0 iOS Rating: 4.8 Our Review Pros: All-in-one platform for spending, investing, net worth, budgeting, and financial planning. AI Financial Advisor that answers questions using your actual financial data in real time. Automatic transaction tracking with smart categorization across all accounts. Built-in budgeting system with AI setup and ongoing progress tracking. Investment tracking across 401(k)s, stocks, ETFs, and crypto with performance insights. Subscription detection and cancellation tools to reduce unnecessary spending. Cons: Relatively high-priced subscription with no free tier. Some features locked behind additional paid services (financial advice, estate planning). Can feel feature-heavy for users only looking for basic budgeting. Our Take: Origin is built for users who want a single AI-driven platform to manage their entire financial life instead of juggling multiple apps. It combines budgeting, spending insights, investing, and financial planning into one dashboard, with an AI Financial Advisor that turns your data into real-time answers and guidance. While powerful, it’s best suited for users who want depth and automation rather than a simple budgeting tool. What Is a Budgeting App? A budgeting app is
How to Open a Taxable Brokerage Account

What Is a Taxable Brokerage Account? A taxable brokerage account is an investment account where you can buy stocks, ETFs, mutual funds, individual stocks, bonds, and other securities. There are no annual caps, and no restrictions on when money can be withdrawn. The “taxable” part of the name describes how your gains in that account are treated. A Roth IRA is funded with after tax dollars, and gains grow tax-free. Traditional 401(k) contributions grow tax-deferred on pre-tax dollars. In a taxable account, capital gains taxes apply in the year a gain is realized, and dividends are taxed in the year they’re paid. That’s a key difference from other investment accounts where taxes are deferred or avoided entirely. Taxable brokerage accounts give you complete flexibility: you can contribute any amount, any time, with no restriction on withdrawals and no retirement savings requirement attached. For those who have maxed out tax-advantaged accounts and want to keep adding to their own investments, a taxable account is the natural next move. Before anyone decides to open a brokerage account, it’s worth knowing that SIPC protection covers brokerage account assets up to $500,000, including a $250,000 limit for cash, if the brokerage firm fails.1 It works similarly to FDIC insurance for a high yield savings account, just structured for investment accounts. Types of Investment Accounts: How Taxable Brokerage Accounts Work When you open a taxable brokerage account, one of the first decisions you’ll make is what kind of account you want. Most brokerage firms will offer you three different options. Cash Account A cash account is the simplest structure if you want to manage your own investments directly. All purchases must be paid for in full, with no borrowing money from the broker allowed. Many investors in cash accounts also hold low-risk, cash-equivalent investments like money market funds, which are commonly used for parking cash while earning interest. For most people opening their first brokerage account, a cash account is the right starting point. Margin Account A margin account is for investors who want to be able to borrow money from the broker to make purchases. This can increase your purchasing power, but losses can also be amplified in the same direction as gains. One thing to look out for is that some brokerage applications will default to a margin account when you open a new account.2 Make sure you know what you’re getting into before you make that final commitment. If options trading is part of your plan, you will also need to review and acknowledge the options disclosure document. Managed Brokerage Account A managed brokerage account is for investors who want to put their portfolio in the hands of a professional or robo-advisor. This means you’ll be guided by the investor’s goals and risk tolerance, and there will be an advisory fee on top of the standard costs of the funds you’re buying. It’s a good option for anyone who wants a hands-off approach to owning mutual funds, ETFs and individual stocks. How to Open a Brokerage Account Step by Step Taxable brokerage accounts can be opened at most major brokerage firms in about 10 to 15 minutes. Here’s what to expect at each stage. Setting Up Your New Account To open a brokerage account, you’ll need to provide the same basic information as you would to open a bank account: name, address, Social Security number, date of birth, and employment status. You’ll also want to be prepared to answer some questions about your investment goals and risk tolerance. Most brokerage firms link to your bank account, savings account or checking account to make it easy to transfer funds. Many platforms have a $0 minimum investment requirement to get started, and your account will usually be ready to use within minutes of funding. Before you finalize the new account, double-check to see if it defaults to a cash or margin structure – some applications will default to margin, which is worth checking before you click through to the final setup steps. What to Look for in a Brokerage Firm For people ready to get started investing and open a brokerage account, the key things to be thinking about are commission free trading, being able to start out with $0 in your account, and having a range of investment options including ETFs, mutual funds and individual stocks. The quality of the mobile app, how easy it is to get help from customer service, and setting up automatic investment contributions all play a part in the comparison. For a side-by-side of the best brokerage accounts available at the moment, InvestLane has put together a detailed rundown to look over before making a decision. Capital Gains Taxes in a Taxable Brokerage Account When you sell investments at a profit in a taxable brokerage account, it triggers a taxable event. You will pay capital gains taxes in the year you actually get the gains, and understanding how capital gains tax rates work can make a real difference in how much you get to keep. Short-Term Capital Gains Short term capital gains apply to investment earnings from assets you hold for one year or less. These gains are taxed as ordinary income at the investor’s standard federal tax rates, which can run as high as 37% for top earners.3 The tax treatment here applies the same way to wages and salary. Investors pay taxes on short-term gains at their top marginal rate, with no special treatment for investment income held less than a year. The Benefit of Long Term Capital Gains Hold onto an investment for longer than a year, and the rules change. You qualify for lower tax rates: 0%, 15%, or 20%, depending on how much taxable income you have. For 2025, if you’re single and your taxable income is $48,350 or less, you pay 0% on long term gains. Most middle income investors fall into the 15% bracket. And just think about how much of a difference that can make. Take a $10,000 gain that
What Is a Taxable Brokerage Account?

What Is a Taxable Brokerage Account? Most people start out with some type of retirement account. Maybe a 401(k) through work, or a Roth IRA of their own. Those accounts have some great tax benefits, but they come with rules such as contribution limits, income restrictions, and age requirements for withdrawals. A taxable brokerage account doesn’t have any of those constraints. A taxable brokerage account is just a standard investment account held at a brokerage firm. You can buy and sell stocks, ETFs, bonds, REITs and other securities with no cap on how much you put in, no income phase-out, and no penalty for withdrawing money any time you like. The tradeoff is that the tax treatment is a bit different that that of tax-advantaged accounts. Capital gains, dividends and interest income in a taxable brokerage account get reported to the IRS in the year they’re earned. That’s different from a 401(k), where you get to defer taxes until withdrawal, and from a Roth IRA, where qualified withdrawals are tax-free. Having a good understanding of the tax implications for each account type is key to using a taxable brokerage account effectively. Keep in mind that this is an investment account, not a savings account. The money you put in is still subject to market risk, alongside the potential for long-term growth. Since it’s a taxable account, choosing tax-efficient investments can also help reduce unnecessary tax drag, as discussed in our article 5 Tax-Inefficient Investments to Avoid in Taxable Accounts. » Start investing today: Explore top brokerage accounts with our detailed review Investing Beyond Retirement Accounts There’s a common assumption out there: that once you’ve maxed out your 401(k) and Roth IRA, your investing job is done. That assumption can keep you from some real opportunities to grow your money. Retirement accounts are designed to be capped, by law. A taxable brokerage account has no such ceiling. It’s great for excess retirement savings after you’ve hit those limits, and it’s perfect for goals that fall outside traditional retirement age, like building up a down payment, buying an investment property, or even trying to reach financial independence before 65. Contribution Limits and Income Limits: What a Taxable Brokerage Skips The 401(k) employee contribution limit for 2026 is $24,500, and that’s before any employer match. The Individual Retirement Account (IRA) limit is $7,500 total across all IRA accounts, since IRAs are funded entirely with your own money and not tied to an employer plan.1 A taxable brokerage account, on the other hand, has none of those restrictions. No annual cap. No income limits. No April 15th deadline. For investors who’ve hit their retirement account contribution limits, a taxable brokerage account is where the rest of their capital can go. Stocks, Mutual Funds, and ETFs: What You Can Hold Here Taxable brokerage accounts open up a wide range of investment options for you. Stocks, ETFs, bonds, REITs, and mutual funds are all available, along with most investment options found inside a specific retirement account. One distinction that is important: ETFs tend to be more tax-efficient than mutual funds in a taxable account. Mutual funds can push capital gains distributions to shareholders even when nothing was sold, creating a taxable event the investor didn’t trigger. For anyone trying to manage annual taxes carefully in taxable accounts, tax efficient investments like ETFs are worth prioritizing over mutual fund alternatives. How a Brokerage Account Is Taxed A brokerage account taxed at the standard rates on realized gains works differently from tax deferred accounts where gains accumulate without annual reporting. There are three events that create a tax obligation: selling at a gain, receiving dividends, and earning interest income. The timing of when you sell will determine what you pay taxes on in a given year. Capital Gains Tax Rates: Short-Term vs. Long-Term The capital gains tax rates that you end up paying depend on how long you held the investment. Short term capital gains, on securities held 12 months or under, are taxed as ordinary income, with top rates reaching 37%. Long term capital gains, from investments held more than 12 months, are much lower. Rates start at 0%, then go to 15%, or 20% based on taxable income.2 For 2026, the 0% long term capital gains rate applies up to $48,350 in taxable income for single people and $96,700 if you are married filing jointly. Many middle-income investors fall in that range and pay taxes on short term gains but nothing on long term capital gains. The practical value here is real. Hold a position for 13 months instead of 11 and a $5,000 capital gain moves from being taxed as ordinary income to the long term capital gains rate, and that shows up in real dollars on your tax return. Tax Loss Harvesting to Cut Your Tax Bill Tax loss harvesting is one of the more useful tools available to investors. When an investment has fallen in value to below what you paid for it, selling it locks in a loss that you can use to offset capital gains taxes first. If there’s still a loss after offsetting gains, the remainder can reduce your ordinary income by up to $3,000 per year. Anything left over then carries forward to future years.3 This tax strategy is only available in taxable brokerage accounts though. Gains and losses inside a 401(k) or IRA aren’t tracked annually for tax purposes, so there’s nothing to harvest inside those accounts. Important thing to remember: the wash-sale rule. Selling at a loss and buying back the same or substantially identical security within 30 days before or after the sale cancels the deduction. To keep the benefit, just wait out the 30-day window or replace the position with a similar but distinct holding. Tax Deferred Accounts vs. Taxable Accounts Traditional retirement accounts work on a tax deferred model: you get a tax deduction when you make a contribution, which lowers your income for the year. The money then compounds tax free until
Markets This Week: 5 Things to Watch

The market was rocked this week by a flurry of economic and political data. Some major developments included new inflation data, changes in Federal Reserve leadership, and rising U.S. Treasury yields. The market swiftly corrected on Friday following a rally during previous trading sessions. The combination of weaker economic data and ongoing political tensions will likely continue to shape equity market sentiment in the upcoming weeks. Below are five major economic and capital market developments this week to keep on your radar. 1. April CPI Report April’s new CPI report came in hotter than expected. The Consumer Price Index (CPI) rose by 0.6% MoM on a seasonal basis, equivalent to 3.8% YoY increase.1 One of the main drivers of this annual increase was the 3.8% YoY rise in energy prices, while all items minus food and energy only rose by 2.8%. Sustained political tensions in the Middle East could produce more unfavorable readings in the upcoming months and would put pressure on the Federal Reserve’s monetary policy. 2. Oil Prices Continue to Rise Amid Geopolitical Tensions Oil prices rose by more than 3% on Friday amid heightened geopolitical tensions in the Middle East. The price of crude oil reached $106/barrel on Friday, representing a 11% weekly gain.2 Oil ETFs rallied by around 3-4% during the trading week. Rising oil prices will likely continue to put pressure on the Fed’s interest rate policy and could also continue to push treasury yields upward. 3. New Federal Reserve Chairman Kevin Warsh has been appointed the new incoming Fed Chairman, following a strong pushback from President Donald Trump on his rate policies.3 The Federal Reserve recently chose to keep rates steady during its recent meeting, due to fears of the consequences of prematurely cutting rates amid the current supply-side and inflationary tensions.4 While Warsh has been more vocally supportive of potential interest rate cuts, the surge in food and energy prices will make this feat difficult in the short term. 4. Rising Treasury Yields and Equity Market Impact The rate on U.S. Treasury yields recently surged to a 1-year high of 4.6% amid new inflationary concerns in the market.5 Additional pressure may force yields back to the previous 2023 high of nearly 5% under the Biden Administration. One important factor to monitor is the impact on U.S. equity markets, which currently track at multi-year highs in terms of valuations. Rising yields may push more investors in the market to prefer treasuries over equities. 5. Semiconductor Boom Reverses This Week Semiconductor stocks posted strong gains during the past week, but began to correct during this trading week. The iShares Semiconductor ETF fell by more than 3% this week, following its massive rally during the previous trading week. However, these equities have rallied by more than 60% YTD, well ahead of the S&P 500 and other sectors.6 Semiconductor giants like Nvidia have historically been some of the main drivers of the S&P 500’s rally. Any setbacks could be detrimental, especially if they are paired with a broad-based correction in tech equities. » Start investing today: Explore top brokerage accounts with our detailed review
How to Open a High Yield Savings Account

Why a High Yield Savings Account Beats Traditional Banks Let’s say you have $10,000 sitting in a Chase or Bank of America savings account. At the national average, that balance earns you roughly $39 a year. Move the same $10,000 to a high yield savings account paying 4% APY and the interest jumps to about $400 after a full year, assuming rates stay constant. Same money, same risk profile, but now you make ten times the return. Feature Traditional Bank Savings High Yield Savings Account Typical APY 0.39% (national average) 4% Interest on $10,000 (1 year) $39 $400 FDIC insured Yes, up to $250,000 Yes, up to $250,000 Branch access Yes, physical branches Online only at most banks Monthly fees Common, sometimes waived Usually none Minimum balance Often required Often $0 Account opening In person or online Mostly online, typically 10 to 15 minutes The National Average vs. High Yield Accounts The FDIC tracks what most banks actually pay, and the national average savings rate was just 0.39% APY as of March 2026.1 Many banks tied to physical branches still pay near that floor, and most savings accounts at the big chains basically do the same. High yield savings accounts are typically offered by online-only banks and many pay around 4% APY currently. The reason is simple: online banks don’t have those branch overhead costs and pass higher interest rates back to depositors at every high yield savings account they offer. For a fuller comparison between liquid cash and locked-rate options, our breakdown of a high yield savings account vs. a CD walks through the tradeoffs side by side. When Traditional Savings Accounts Still Make Sense Traditional savings accounts at brick-and-mortar banks earn their place when you actually use the branch. In-person cash deposits, notarized signatures, safe deposit boxes, and same-day cashier’s checks are easier to handle face to face. Some people prefer keeping a checking and savings account under one roof for easy access during a banking errand. They can also serve as a convenient holding place for short-term cash or funds you plan to move soon, since easy branch access and instant transfers can matter more than earning higher interest in those situations. Credit unions can fall in this bucket too. Credit unions sometimes pay higher interest rates than the big traditional banks. Even so, traditional savings accounts at the largest chains usually trail high yield options. However, for longer-term savings, traditional accounts at major banks generally earn significantly lower interest than high yield savings accounts. » Earn more on your savings: Explore top high-yield savings accounts today How Much Interest You Can Actually Earn So how much interest can a few thousand dollars actually earn in a high yield savings account? More than you might guess, but the math has two moving parts: the APY and the time your money sits at that rate. Annual Percentage Yield Explained APY (Annual Percentage Yield) is the rate that determines how much interest your savings earn over time, including compounding. One thing to keep in mind: a high yield savings account pays a variable rate that the bank can change at any time, which is different from fixed income products like CDs or Treasury bonds. With a CD or a Treasury bond you lock in a fixed interest rate for a set term, so you trade some flexibility for a known payout. A high yield savings account keeps your cash liquid and pays whatever the current rate is, while a CD or bond holds the rate fixed until maturity. » Looking for a guaranteed income? Explore today’s top CD rates How Compounding Interest Builds Your Balance Compounding interest pays you on prior interest, not just the original deposit. On $5,000 earning 4% APY, the $200 in interest you collect in year one means year two starts on a $5,200 balance, so the next $200 in interest already builds on a bigger base. That snowball is what compounding pays for, and the gap over simple interest widens every year you leave the balance alone. Reinvesting interest is a way to make money grow without taking on stock market risk. This is especially useful when paired with investing, since keeping short-term cash in a high-yield savings account allows your investments to stay allocated in the market without pulling from them for short-term needs. For a closer look at where to invest beyond savings, explore the best brokerage accounts for building long-term wealth. Tying balances to specific savings goals helps your money grow faster because you stop dipping into the account for purchases that were not part of the plan. For more on options for cash you may need within a year or two, see our guide to the best places to park short term cash for the full picture on liquid alternatives. Steps to Open a High Yield Savings Account Opening a new savings account online is fast. Most applications take 10 to 15 minutes if you have your documents ready. Move through them in order and you will be earning higher interest rates on day one. Step 1 – Compare Accounts Start by comparing accounts on more than just the headline APY. Pull up at least three high yield savings accounts and put them side by side. Check the APY, monthly fees, the minimum deposit requirements to open, the minimum balance requirement to earn the top rate, and the withdrawal rules. Some banks pay the advertised APY only above a certain balance threshold, which is a quiet way to reduce earnings on smaller deposits. Many banks also charge monthly fees that erase the rate advantage entirely. The goal is to find a high yield savings account where you avoid fees, hit no minimum balance trap, and still get top-tier interest rates. Our review of the best high-yield savings accounts for 2026 compares the leaders side by side, weighing APY against the fee structure each bank uses and the deposit requirements you’d run into. That makes it easier to spot which
What Is a High-Yield Savings Account?

What Is a High-Yield Savings Account? Most savers think every savings account works the same way, but they don’t. A high-yield savings account is a deposit account at an FDIC-insured bank or NCUA-insured credit union that pays a much better interest rate compared to a standard savings account. The product itself is the same. The yield is what changes. The U.S. Securities and Exchange Commission points out that some savers keep up to six months of income in savings to cover an emergency like sudden unemployment.1 A high-yield savings account is the perfect place to put that cash, you get a higher rate than a traditional account with the same safety and liquidity. » Earn more on your savings: Explore top high-yield savings accounts today How a High-Yield Savings Account Works The mechanics are simple. You deposit money, the bank pays you interest on the balance. Interest typically accrues daily and gets credited to your account once a month. That’s the basic idea behind a high-yield savings account. What changes between banks is the interest rate they offer and the minimum balance they need to get you that rate. Where Higher Interest Rates Come From Banks set high-yield savings APYs based on the federal funds rate, which is the rate banks charge each other for overnight lending. The Federal Reserve held the federal funds target range at 3.50% to 3.75% at its April 29, 2026 meeting.2 When the Fed moves on interest rates, your savings account feels it almost right away. Online banks and other financial institutions then quote an annual percentage yield on top of that rate, which means the interest rates you see today can change. Compounding Interest Explained Compounding interest means you earn interest on the interest you earn. Most high-yield accounts earn interest daily and pay monthly, so each payout grows your savings balance, and the next month’s interest is calculated on the larger balance. For example: $10,000 at 4% APY adds up to roughly $400 over a year if rates hold. Higher balances add up faster, since every dollar of interest earned starts working the next day. HYSAs vs. Traditional Savings Accounts Here’s where the math gets interesting. The FDIC reports that the national average savings rate is at just 0.39% as of its March 2026 update.3 Meanwhile, the best high-yield savings accounts are paying about 4% APY, a difference of about a factor of 10. That difference is the entire reason these accounts exist. Traditional banks like Chase, Wells Fargo, and Bank of America rely on physical branch networks and customer inertia, so they have less pressure to compete on interest rates. Online banks compete almost entirely on yield, which is how they offer higher interest rates than the brick-and-mortar competition just can’t match. What That Interest Rate Difference Actually Pays You Let’s run the dollars: $10,000 at the 0.39% national average pays you roughly $39 a year in interest. That same $10,000 earning 4% pays you $400. On a $25,000 balance, the difference is even bigger, about $903 a year. That’s more money that stays in your pocket, not the bank, and that interest works for goals like a big purchase or a home down payment. Where to Find a High-Yield Savings Account Why do online banks pay more? They cut out the cost of running physical branches and pass the savings on in the form of higher rates. Three kinds of financial institutions offer up high-yield savings products: online-only banks, credit unions, and the online banking arms of larger brands like SoFi, Capital One, American Express, and Discover. All three can deliver accounts that far outpace your run-of-the-mill savings account at a main street bank. Online Banks Online banks operate without the traditional branch network. Ones like SoFi and Capital One 360, are the online divisions of major brands that got their start in lending or credit cards. You sign up online or in a mobile app, link an external bank account and transfer funds over. To compare top options when it comes to yield, fees, and features, take a read of InvestLane’s review of the best high-yield savings accounts for 2026. Credit Unions Credit unions aren’t FDIC insured, but that doesn’t mean accounts are uninsured. The National Credit Union Administration runs a parallel system that covers member accounts, up to $250,000 per member-owner per federally insured credit union per ownership category.4 Many credit unions offer high-yield savings products at competitive interest rates, sometimes combining higher interest rates with stronger relationship perks than online banks deliver. The APY posted on a credit union’s website is probably the closest thing to apples-to-apples comparison. » Boost your savings: Explore the best savings and CDs with Raisin Is It FDIC Insured? Safety Basics The Federal Deposit Insurance Corp, formally the FDIC, covers deposits at insured banks up to $250,000 per depositor, per FDIC-insured bank, per ownership category.5 That coverage starts automatically the moment you open the account. No application. No paperwork. The same deposit insurance applies to every member FDIC institution offering high-yield savings accounts, so you can shop around for a higher rate without compromising your safety. Single, joint, and retirement accounts each sit in a separate category. If you have a single account at $250,000 and a joint account with your spouse at $500,000 at the same bank, both balances are fully covered. If you split your deposits across different banks, that adds another layer of protection for your money. Bank failure is rare, and even when it happens, FDIC insurance has historically paid out to every covered depositor. A Low Risk Place for Short-Term Money A high-yield savings account is one of the best places to park your short-term cash. Your principal is insured, and the interest earned beats just about any traditional savings option out there. Most financial planners recommend keeping 3-6 months’ worth of living expenses in cash as an emergency fund, and a high-yield account lets you park that money safely while it earns a higher interest rate than you’d get
Spot Bitcoin and Ethereum ETF Buyer’s Guide for 2026

What Is a Bitcoin ETF? (and How Spot ETFs Work) A spot Bitcoin fund holds actual bitcoin and issues shares you can buy and sell on a normal stock exchange. Spot Ethereum funds work the same way with ether. So you skip the wallets, exchanges, and private keys, and you get to invest in cryptocurrency through a brokerage account you probably already have. This fits the same core principles of ETF investing you already use for index funds. The fund handles custody, security, and the operational work of holding crypto. You hold shares, and the shares track the price of the underlying asset. Investment Objective: Tracking the Underlying Asset Every spot crypto fund in this guide shares the same goal. The fund objective is to reflect the performance of the underlying asset’s price, before fees and expenses. The investment objective for the iShares Bitcoin Trust ETF specifically states the fund “seeks to reflect generally the performance of the price of bitcoin.” Ether-focused funds have parallel investment objective language for ether. When bitcoin moves 5% on a given day, you’d expect the share price to move close to 5% as well, with small variations from fees. » Thinking to buy cryptocurrency? See the top crypto platforms today How Spot Crypto ETFs Hold Digital Assets and Are Regulated Spot Bitcoin and Ethereum ETFs hold digital assets directly, and the regulatory wrapper differs from what most ETF investors are used to. The U.S. Securities and Exchange Commission approved these funds on January 10, 2024, with strict disclosure requirements. The SEC was clear that approval was not an endorsement of bitcoin as an investment.1 Here’s the part you need to pay close attention to: These funds are not registered as investment companies under the Investment Company Act of 1940, and do not have the same regulatory requirements as mutual funds or ETFs registered under that act.2 The protections that come with being an investment company registered under that act do not all apply to spot crypto funds. The funds are structured as grantor trusts or similar pass-through vehicles, and each one trades as an exchange traded product on a major U.S. exchange. They are not commodity pools regulated under the Commodity Exchange Act either. A commodity pool would carry CFTC oversight that these spot funds do not. The fund’s prospectus spells out the structure and risks in detail. So the same regulatory requirements that apply to a typical equity ETF do not all apply to spot crypto funds. The SEC reviewed the disclosures, the listing exchange approved the listings, and the funds operate under their own investment programs. Some protections built into the rules for registered funds are simply not there. Best Spot Bitcoin ETFs for 2026 Four spot Bitcoin funds cover the bulk of investor money in this category. Here’s how they stack up against each other, sized against the largest ETFs in the market for context. iShares Bitcoin Trust ETF (IBIT) IBIT is the dominant fund in the category. As of May 2026, IBIT holds approximately $66.7 billion in net assets, more than five times the next-largest fund in the category, with a 0.25% sponsor fee.3 For every $10,000 invested, that 0.25% works out to $25 per year in fund expenses, taken from the trust’s bitcoin holdings. What stands out about IBIT is how sticky the money is. Even when bitcoin’s market price fell sharply during the first quarter of 2026, IBIT’s net assets held roughly flat while shares outstanding actually grew. Other ishares funds show similar institutional patterns, but IBIT’s market value at scale puts it in a league of its own. How Net Assets Compare Across the Funds Across the four Bitcoin funds, IBIT’s $66.7 billion lead is wide. FBTC sits second at $12.74 billion, followed by BITB at $3.15 billion. Net assets affect liquidity and the ability to handle large trades without slippage. Fidelity Wise Origin Bitcoin Fund (FBTC) FBTC is the second-largest fund in this lineup and Fidelity’s entry. As of Q1 2026, the fund holds about $12.74 billion in net assets across roughly 190,800 BTC. FBTC charges a 0.25% sponsor fee, and it is the only major spot Bitcoin product that custodies its bitcoin in-house, through Fidelity Digital Asset Services rather than Coinbase Custody.4 For Fidelity customers, FBTC slots cleanly into existing accounts. The in-house custody puts Fidelity in direct control of the bitcoin rather than leaving it with a third-party crypto custodian. Grayscale Bitcoin Mini Trust ETF (BTC) BTC is Grayscale’s value entry in the category. The fund charges a 0.15% management fee, the lowest among the major spot Bitcoin funds covered here, and trades as an exchange traded product.5 The math is simple, here is how it works: For every $10,000 invested, BTC’s 0.15% works out to $15 per year, against $25 for IBIT and FBTC. Over a long holding period, that 10 basis point gap compounds in your favor. The trade-off is size though, BTC is smaller and newer than IBIT, so trading volume and liquidity are lower. For cost-sensitive buyers planning to hold for years, the lower management fees can easily outweigh that disadvantage. Bitwise Bitcoin ETF (BITB) BITB is the specialist crypto firm entry, with a competitive 0.20% fee that sits between the major issuers and Grayscale’s BTC. Bitwise is a crypto-native asset manager, appealing to investors who want a fund run by a team focused entirely on digital assets. As of May 2026, BITB holds about $3.15 billion in net assets and 38,576 BTC, with Coinbase Custody Trust Company as the bitcoin custodian. The 30-day median bid-ask spread runs around 0.02%, in line with the larger funds. Best Spot Ethereum Trust ETF Picks Three spot ether trust ETF options cover most of the Ethereum side. Two have “Trust” in their formal names, while Grayscale’s mini ether fund uses “Staking Mini ETF” instead. iShares Ethereum Trust ETF (ETHA) ETHA is BlackRock’s Ethereum entry and the largest spot ether trust ETF. As of May 2026, the fund holds about $7.5 billion in net assets
The 3 Tax Buckets Every Investor Needs To Know

Why Tax Buckets Matter for Long-Term Wealth Most people focus on what they invest in and skip past where those dollars actually live. That gap costs investors real money over time. Two people can buy the same index fund, earn the same investment return, and walk away with very different totals depending on the account type. The three buckets each handle taxes differently. A taxable account hits you every year on dividends, interest, and realized capital gains. A tax deferred account skips taxes now and bills you later. A tax free account collects taxes upfront and stops asking after that. Pick the wrong bucket for a long term goal, and the tax drag compounds for decades. So before investing your money in the market, it helps to understand how each bucket treats your dollars and how it shapes your investment decision over a personal investment horizon that may span 30 or 40 years. Taxable vs Tax-Deferred vs Tax-Free Accounts The taxable vs tax deferred vs tax free framework comes down to one question: when do you pay the tax bill? A normal taxable investment pays the tax now, every year. The taxable tax deferred comparison is simple: you skip the tax bill now and pay income taxes on the back end at withdrawal. The taxable vs tax deferred timing flips again with the Roth. Tax free accounts collect tax upfront. You contribute after tax dollars, then everything that grows inside the account avoids future tax on qualified withdrawals. The investments grow tax free, the earnings grow tax free, and qualified retirement income exits without a tax bite. Each bucket fits different goals. Taxable accounts work for short-term cash and for investing money beyond retirement account limits. Tax deferred accounts shine later in your career when your current income tax bracket is high and your retirement bracket should be lower. Tax free accounts win when you have decades of compounding ahead. » Start investing today: Explore top brokerage accounts with our detailed review How Taxable Accounts Work Taxable accounts include brokerage accounts, high yield savings accounts, money market accounts, CDs, and most bond holdings. There are no contribution limits, no withdrawal restrictions, and no age gate. The price for that flexibility is an annual tax bill on dividends, interest, and any realized gains. Brokerage Accounts and Investment Taxes A brokerage account is where most investors first run into investment taxes. Long term capital gains, on assets held more than one year, are taxed at federal income tax rates of 0%, 15%, or 20% depending on your taxable income, while short term gains hit your ordinary income tax rate.1 Those federal income tax rates make holding period a meaningful tax decision that affects taxable income, and the choice of where to hold a taxable investment can change your annual income taxes by hundreds or thousands of dollars. Capital gains taxes also apply to dividends, and the type is important. Qualified dividends get the favorable long term capital gains rates, while ordinary dividends do not, and ordinary income taxes apply at your federal tax rate. Tax efficient investments like broad index funds and municipal bonds throw off less taxable income each year, which is why investment companies often place them in taxable accounts and steer income heavy holdings into tax advantaged investments. For a more detailed look at this strategy, see our list of investments to avoid in taxable accounts. High-Yield Savings Accounts and Money Market Accounts A high yield savings account and similar parking spots sit in the same bucket but serve a different purpose. They carry significantly lower risk than equity investment funds and are built for short term cash, not long term growth, which makes the personal investment horizon for these dollars short by design. Interest is taxed as ordinary income and reflect sales charges or fees do not apply. A top high yield account currently pays around 4% APY, while a traditional financial institution pay rate sits closer to 0.01%. On a $10,000 emergency fund, that difference works out to roughly $400 a year versus $1. » Earn more on your savings: Explore top high-yield savings accounts today Tax-Deferred Accounts and How They Build Wealth Tax deferred accounts include the traditional IRA, the 401(k), the 403(b), 457(b), SEP IRA, and SIMPLE IRA. The mechanic is the same across the family: you contribute pre tax dollars now, the money grows without annual taxes, and the account pays income taxes later. A tax deferred investment behaves differently from a normal taxable investment in one key way: time on your side without the annual tax drag, and that single change in tax deferred investment treatment is the engine. Withdrawals after age 59½ are taxed as ordinary income at the federal income tax rates in effect that year, which currently run from 10% to 37%.2 Whether the account beats a Roth comes down to your projected timeline and estimated marginal tax rate today versus when you’ll be in retirement. A side by side breakdown lives in our Roth IRA vs Traditional IRA comparison. How Tax Deduction Savings Compound The upfront tax deduction is the immediate tax benefit that makes tax deferred contributions attractive. Every dollar you contribute reduces your taxable income for the year, and that tax deduction stacks year after year. If your federal tax rate is 22%, contributing $7,500 returns $1,650 in tax deduction savings. Reinvest that saved cash, and your net contribution effectively matches your gross contribution, compounding alongside the original investment. The tax-deductible contribution lowers your current tax liability by reducing the income you pay taxes on today, in exchange for a tax bill later. This trade tends to favor investors whose retirement tax bracket is lower than their working-years bracket. Why You Should Increase Tax-Deferred Contribution Late in Your Career Late career earners typically sit in their highest income tax bracket of any working stage. Maxing or pushing to increase tax deferred contribution amounts during these years captures the largest possible deduction and shifts taxes to retirement, when
Backdoor Roth IRA Guide (2026 Update): How It Works

What Is a Backdoor Roth IRA? A backdoor Roth IRA is not a separate retirement account. It is a Roth IRA conversion strategy combining two very different legal moves: a nondeductible contribution into a traditional IRA account, followed by a Roth conversion into a Roth IRA. The strategy exists because Roth IRA contributions are limited by income, but there’s no cap on non-deductible contributions to traditional IRAs or on converting those to Roth’s. Take someone earning $300,000 a year. They can’t contribute directly to a Roth IRA because their income exceeds the limit. But they can legally fund a traditional IRA and move that money into a Roth IRA. Why the Backdoor Roth IRA Strategy Exists In 2010, the IRS removed a rule that had been restricting Roth conversions. This opened up what’s come to be known as the backdoor Roth IRA strategy. High earners were still locked out of direct Roth contributions, but the combination of a non-deductible traditional IRA and a Roth conversion suddenly became an option. Before you consider using this strategy, you should check the current Roth IRA income limits to see if you need to go the backdoor route. » Ready to invest for retirement? Check out our review on the top IRA accounts Who Qualifies for a Backdoor Roth IRA? The backdoor Roth is perfect for people whose MAGI exceeds the Roth phase-out range. If you’re single and your 2026 adjusted gross income (AGI) is above $168,000, you won’t be able to contribute directly to a Roth IRA. If you’re married filing jointly and your AGI is above $252,000, you’re facing the same issue.1 Then there’s the eligibility test. You need to have earned income at least equal to the Roth IRA contribution amount, the ability to open a traditional IRA, and no existing pre tax SEP or SIMPLE IRAs balances that would complicate the strategy. Income Limits That Make the Backdoor Strategy Necessary For 2026, the Roth IRA income limits work like this: single filers phase out between $153,000 and $168,000, married filing jointly phases out between $242,000 and $252,000. And if you’re a married filing separately taxpayer who lived with your spouse, you’re looking at a phase-out range of $0 to $10,000.2 Once you clear these thresholds, direct Roth IRA contributions are no longer an option, and the backdoor becomes your next move. » Stay ahead of your finances: Join our free newsletters today How the Backdoor Roth IRA Process Works The backdoor Roth IRA process has two steps: a nondeductible IRA contribution through a traditional IRA, followed by a Roth conversion of that balance. Both steps have to be done right, and reported correctly on your tax return. The IRS has not published a mandatory waiting period, and most practitioners handle the conversion within days of the initial Roth IRA contribution to keep tax exposure to a minimum. What Happens in the Traditional IRA Contribution Step? The first step is to make a non-deductible contribution into a traditional IRA using money that’s already been taxed. For 2026, the IRA contribution limit is $7,500 for those under 50, or $8,600 with catch-up for those 50 and older. What you’re doing here is making a contribution using dollars that you’ve chosen to contribute to after tax. You’re not taking any tax deduction. You’ll need to open a traditional IRA at a brokerage before you can fund it, and this is a non-deductible contribution, not one of the deductible contributions you can make at lower income levels. You’ll also need to file Form 8606 to set up the basis on your tax return. Filing Form 8606 for the year of the non-deductible contribution is not optional. That’s how the IRS knows the money’s been taxed and shouldn’t be taxed again when converted.3 What Happens During the Roth Conversion Step? The second step is to shift funds from traditional IRA to a Roth IRA. Backdoor Roth conversions can be done through a trustee to trustee transfer or a 60-day rollover.4 The majority of people use the direct transfer method as it’s simpler to do. If a traditional IRA just holds a nondeductible amount then the conversion produces very little ordinary income and the converted funds then grow tax free. What Is the Pro Rata Rule and Why Is It So Important? The pro rata rule is the single biggest reason a backdoor Roth IRA can go completely sideways. Under this IRS rule, any Roth conversion is treated as coming proportionally from all traditional, SEP, and SIMPLE IRA balances, not from a specific contribution.5 It prevents cherry-picking from nondeductible basis while leaving large pre tax balances untouched. The math works like this. Someone with $93,000 of pre tax IRA balances plus a fresh $7,500 nondeductible contribution holds $100,500 in total IRA assets. If they convert the $7,500, roughly 92.5 percent becomes taxable income because 92.5 percent of the balance is pre tax. Only about $560 is treated as tax free return of basis. The other $6,940 gets taxed as ordinary income at the marginal tax rate, creating unexpected tax liability. How IRA Balances Affect the Pro Rata Calculation The pro rata rule bundles together all balances on December 31 of the conversion year. Traditional, SEP IRA, SIMPLE IRAs, and rollover balances all count toward the total, but Roth IRA and 401(k) balances do not.6 A person with no existing pre tax IRA balance has the cleanest setup, while deductible and nondeductible contributions get blended proportionally across every conversion until any pre tax balance is cleared. The 401(k) Workaround for Pro Rata Problems Rolling pre tax IRA balances into a current 401(k) or other workplace retirement plan removes those dollars from the aggregation. Once inside a 401(k), they no longer count toward the pro rata denominator, which is why people with large pre tax balances often roll them into a 401(k) before starting a backdoor Roth. Not every 401(k) plan accepts incoming rollovers. Plan rules vary, and the rollover must be completed before December 31 of the conversion
Lump Sum vs Dollar Cost Averaging | Which is Best?

What Is the Difference Between Lump Sum and Dollar Cost Averaging? Lump sum investing and dollar cost averaging are two different ways to put cash into the financial markets. Both have fans, and both are backed by research. With a lump sum investment, you simply take the entire amount you are going to invest and put it into the market all at once. You get full exposure on day one. With dollar cost averaging on the other hand, you break up that same amount into smaller pieces and invest it over weeks or months. The idea here is to smooth out the effect of fluctuating price levels and reduce timing risk. For example, let’s say you have $12,000 sitting in cash. A lump sum approach means investing all $12,000 today. A dollar cost averaging (DCA) approach might split it into a fixed amount of $1,000 a month for a year. Is Dollar Cost Averaging the Same as Investing From Every Paycheck? Not exactly. When you invest every time you get paid, available cash goes to work immediately. That is actually a series of small lump sum investments, not a true cost averaging strategy. The real comparison here only applies when you have a large sum of money sitting in cash and you are looking for ways to deploy it. » Start investing today: Explore top brokerage accounts with our detailed review What Are the Pros and Cons of Each Investment Strategy? Each investment strategy carries its own tradeoffs. Understanding them helps match the approach to your investment objectives and financial goals. Lump sum investing gives instant market exposure. No cash sits on the sideline. The downside is timing risk. If the market drops right after you invest, you feel the full hit. Dollar cost averaging reduces that short term volatility. By buying at different price levels, your average purchase price smooths out. There is a tradeoff though: you end up giving up potential gains while only a portion of your cash is working. Factor Lump Sum Investing Dollar Cost Averaging Market exposure Immediate Gradual Entry timing exposure Higher Lower Expected returns Higher on average Lower on average Stress during volatile markets Higher Lower Best for Long time horizon, higher risk tolerance Risk averse investors, bear market concerns For investors who lose sleep over market swings, DCA can act as a behavioral anchor. For those focused on maximum long term growth, lump sum investing tends to win. Why Does Time in the Market Beat Market Timing? This is at the heart of the whole debate. Markets tend to rise over time and cash sitting idle earns next to nothing while share prices climb. J.P. Morgan’s 2025 Guide to Retirement put real numbers on this. Missing the 10 best days of the market over the past 20 years would have cut a portfolio’s annualized return by almost 50%. Missing the top 40 days would have produced a negative annualized return.1 The trouble is that many of the best market days happen during rough patches. Pulling out during a downturn, even for a few weeks, can wreck long term results through extended periods of missed gains. See our breakdown of why trying to time the market could cost you thousands. What Happens When You Wait for the Right Market Entry Points? Charles Schwab ran a 20-year study ending in 2024 tracking five investors who each received $2,000 at the start of every year. Peter Perfect invested at the annual low. Ashley Action invested immediately. Matthew Monthly used dollar cost averaging. Rosie Rotten had the worst timing possible. Larry Linger held cash and kept waiting out the market volatility. The results were striking. Peter Perfect finished with $186,077. Ashley Action, who never tried to time anything, landed at $170,555. Larry Linger, who kept waiting for better market conditions, ended with just $47,357.2 Let that sink in for a minute. The investor with bad timing still crushed the one who held cash. Waiting indefinitely is the worst thing you can do in nearly every market cycle. What Does Historical Performance Say About Lump Sum vs Dollar Cost Averaging? Research from major firms lines up. Vanguard compared lump sum investing to dollar cost averaging across rolling periods from 1976 to 2022. As it turned out, the lump sum investment approach beat dollar cost averaging most of the time, with the gap getting bigger as the DCA periods stretched.3 The pattern held across asset allocations too. The bigger the equity stake in the portfolio, the bigger lump sum’s edge over DCA. The reason is the same one that drives the whole argument: stocks and bonds carry a risk premium over cash, and a lump sum approach holds less cash across the life of the investment, so it captures more of that premium. » Stay ahead of your finances: Join our free newsletters today When Does Dollar Cost Averaging Actually Win? Dollar cost averaging has a clear edge in one particular case: a sustained bear market. When the market fluctuates downward month after month, buying at lower prices pulls your average purchase price down. Consider a quick example. You invest $600 into a particular investment at $25 per share all at once. Your cost basis is $25. Now let’s say instead you bought $100 a month for six months while bond prices and stock prices fell. Your average share price might end up closer to $22.90. If the price now sits at $21.38, so that lump sum investor is down 14.48% while the DCA investor is only down 6.64%. Keep in mind though, historically, markets drop in fewer than 25% of 12-month periods. That leaves roughly 1-in-4 years where DCA could help, which is why it is not necessarily a bad strategy. The downside though: it tends to underperform during a rising market. Over the long term, markets have consistently trended upward, despite periods of short-term volatility and economic uncertainty. In declining markets, dollar cost averaging can feel safer than lump sum investing, as it spreads out entry
